
Bitcoin Momentum Model Update
Update & performance review after once month since introduction

We recently introduced the Bitcoin Momentum Model on January 6th at the price of $93K in an article open to all subscribers (link). In this article, we provide an update and discuss how the model performed since then.
Overview of the Bitcoin Momentum Model
The Bitcoin Momentum (BM) model is a systematic framework that turns recent Bitcoin price action into a practical risk-management signal – helping you recognize regime shifts, reduce exposure during prolonged bearish periods, and stay invested during sustained uptrends.
Our introductory piece motivated why momentum is especially powerful in Bitcoin and how the model operationalizes it. It defined momentum as the tendency for trends to persist, strength leading to further strength, and weakness leading to further weakness, and argues Bitcoin is unusually momentum-driven because it lacks traditional valuation anchors, trades 24/7 in a globally speculative market, and is amplified by leverage and reflexive flows (rising prices pull in demand; falling prices suppress it).
The Bitcoin Momentum Index (BMI): the model generated a momentum score computed from the last several months of price action, with added safeguards to reduce short-term noise. On any day, BMI is calculated using only information available up to that date (no lookahead), and the output is framed as bullish (positive), bearish (negative), or transition/neutral (near zero), visually shown as green/red/white-ish zones.
Historically, BMI stayed positive through most bull phases and negative through most bear phases, so following it would generally keep you in during “good times” and out during “bad times,” without pretending to nail exact tops/bottoms.
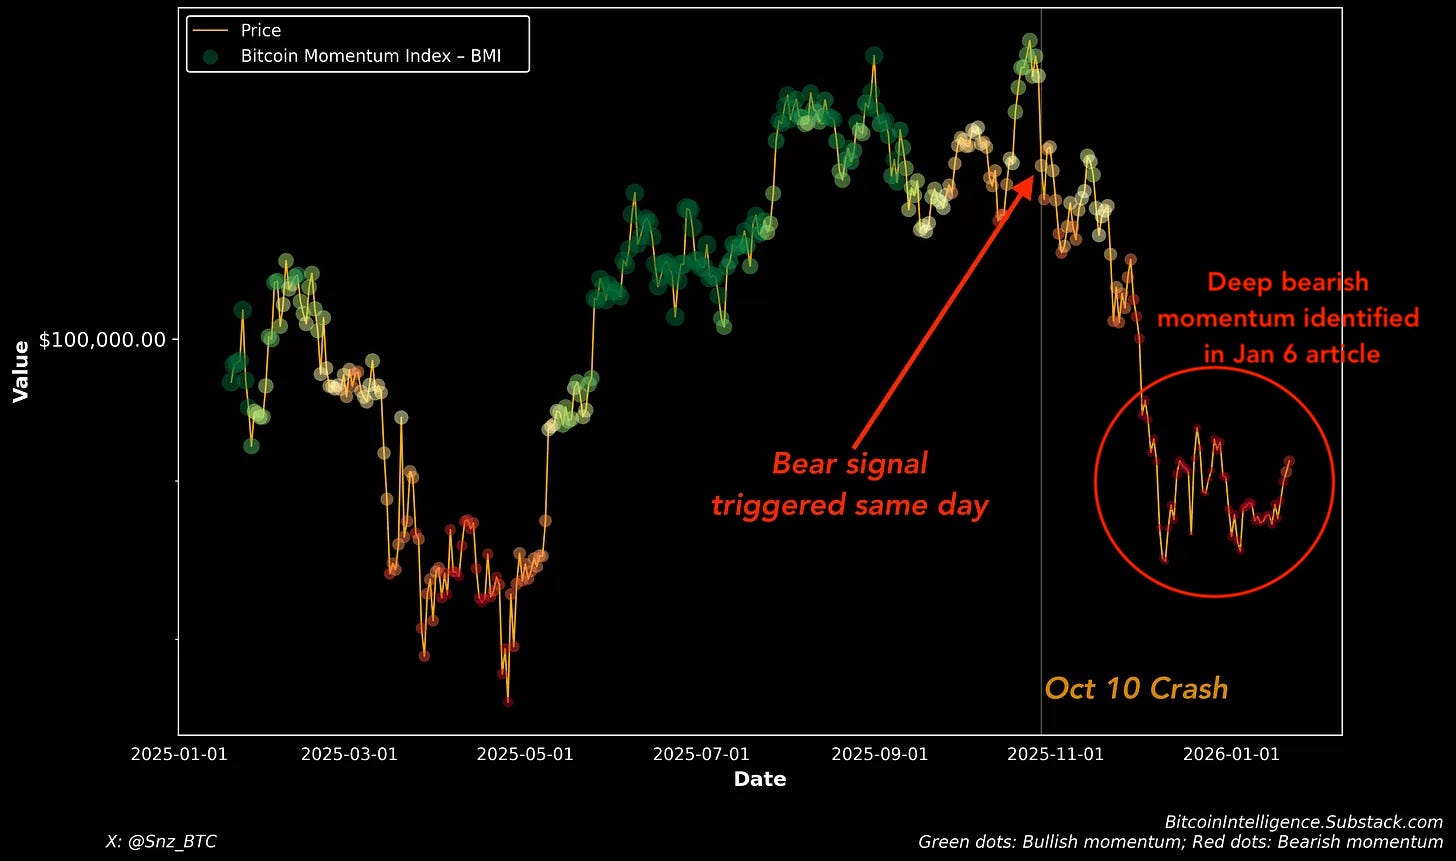
We illustrated its behavior in real time by highlighting a recent crash example: BMI flipped from positive to negative on October 10 (the same day the bear phase began), after momentum had already weakened from September 1, with some brief “fake-out” signals that corrected quickly.
The intended takeaway from this research is the model provides “protection”: treat negative BMI as a prompt to take precautions (trim exposure, reduce allocation, hedge, avoid leverage), not as a guarantee that a crash must happen, and optionally require confluence with a second signal to reduce false positives.
Below is how the chart looked back then. It shows that at the time, the momentum was deeply negative (the red dots).
About a month has passed, and it’s time to revisit the accuracy of the model.
Momentum Model Update
Bitcoin price was at $93K when the article came out, showing bearish momentum. Price is now significantly lower at $71K as of writing, and the momentum is bearish.
The false positive & subsequent correction. Interestingly, after this initial bearish signal, the price tried to recover a bit and briefly pushed momentum into a slight positive value, giving a false signal. But it did not last, and quickly another bear momentum signal was triggered. Then we crashed further.
This is the same chart now.

And here is the longer-term view.

As can be seen, the Momentum signal has historically been fairly accurate, turning green where it was a good time to be in the market and turning red when risk was high. But it is by no means perfect, as no model will be. Especially, it may not catch the bottoms and instead waits for a really safe place to get you back in. This may actually be a good feature, as you never know which dip is the real bottom. As we saw in the recent crash to $90K was not the real bottom. The model waits a lot before flashing green to be abundantly sure that momentum is back, and even then, it may briefly give a false signal before correcting it.
Here is a closer look at the last 1 year of data and how the recent market action was handled.

Performance Summary
Shortly after the $124K peak, price dipped down and the signal color changed to orange or weak green at times, clearly showing market weakness. Then the real crash began. The model successfully kept you out of the market. And as the price started recovering, it flashed a false green signal. As that was proven to be a mistake, it was quickly identified that bearish momentum is back and triggered a bear signal.
You would have lost money on a trade based on that false signal on the way down from about $95K to $90K. But the model overall kept you out of the market during the crash from $110k to $90K and then down to $70K.
Here is a chart that shows the periods you would have been in the market during the recent market action.

About 90% of the crash is sidestepped. This is as good as I would personally expect. Stellar outcome, transparent and published ahead of time.
Future Guidance
Now, momentum is deeply negative again with the momentum index at -1.14 (above image). Does this mean we will definitely go lower? Not necessarily. It does mean that the price has a strong negative momentum and that we are statistically in the bear zone.
Like a rock that has fallen off a cliff. It may hit other rocks here and there, and even bounce back up. But it has a heavy downward momentum. Statistically the direction is bearish. But it will end. Just like when the rock reaches the ground. At the point, you would see the rock slowing down and maybe even doing a few bounces up and ultimately stabilizing on the ground. Similarly, the BMI will start improving and stabilizing in the positive territory. This will indicate that statistically an uptrend has begun and it is safe to get positioned.