
The Zero Line Broke
Bitcoin Momentum Model Update

June 2, 2026
Introduction
The Bitcoin Momentum Model converts recent price action into a simple regime signal: bullish when momentum is positive, bearish when momentum is negative, and transitional when momentum is near zero. The point is not to call exact tops and bottoms. The point is to manage risk by staying exposed during sustained uptrends and getting defensive when the trend breaks.
In practice, green means add or hold risk, red means reduce risk or do not add, and the zero line is the danger zone. Near-zero momentum is not comforting. It is the place where the prior trend is vulnerable to failing.

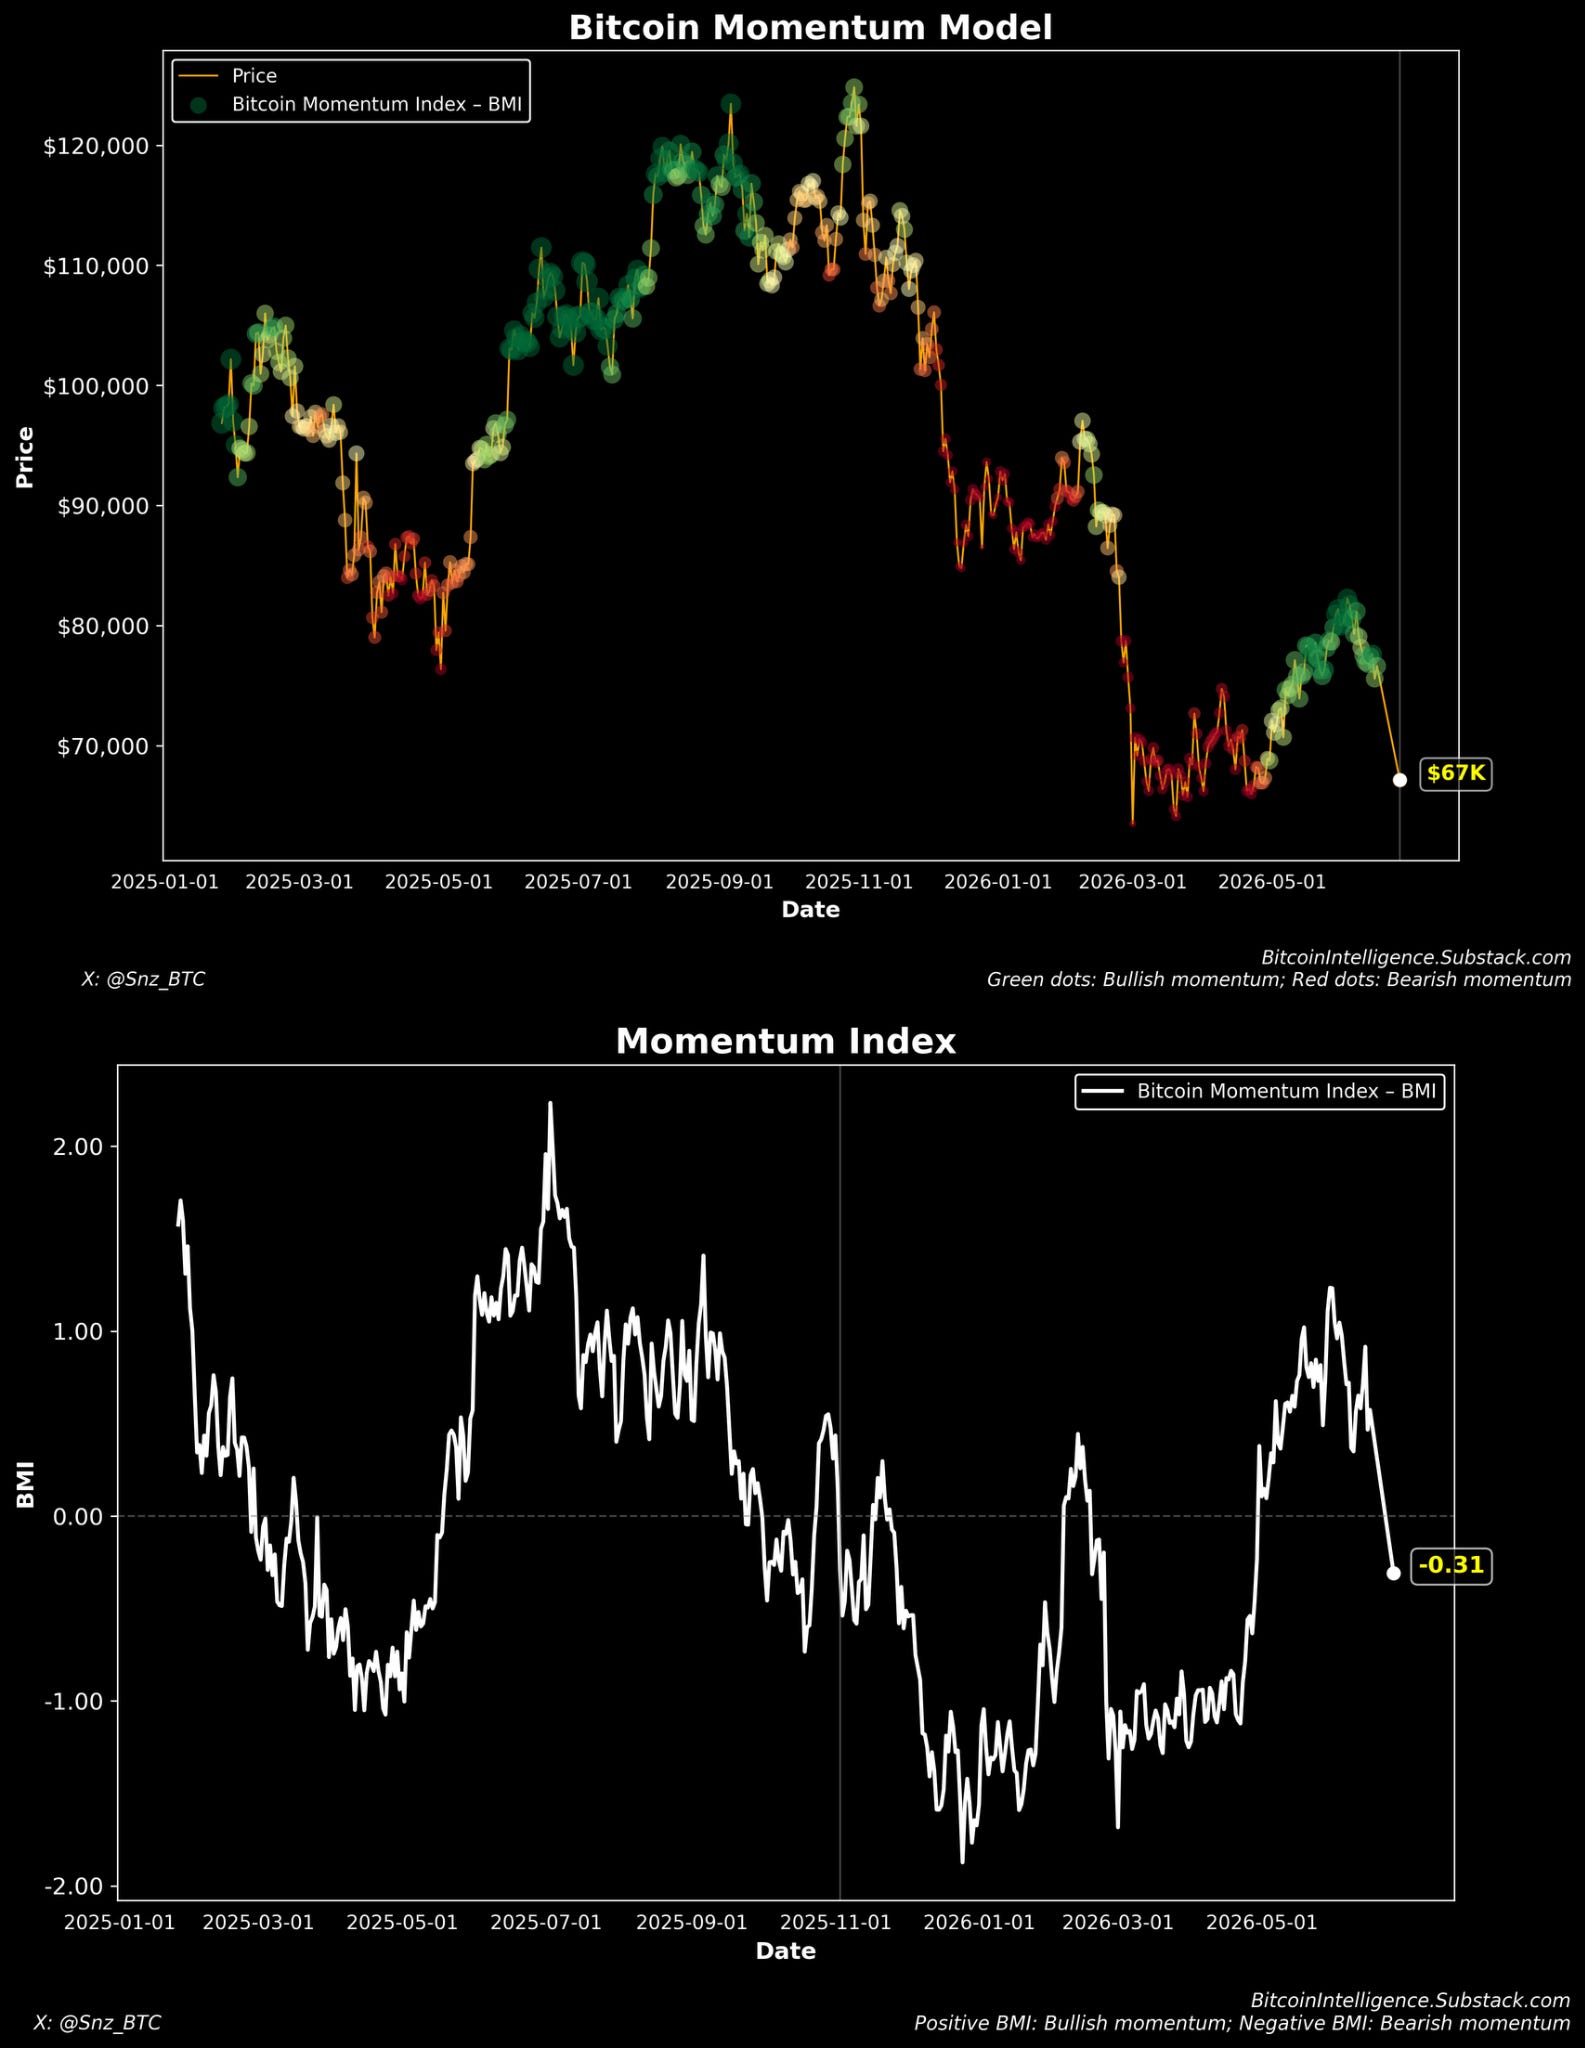
As of this update, Bitcoin is near $67K, and the Bitcoin Momentum Index (BMI) is at -0.31. The model is no longer in a weak-but-holding state. It has moved back into a bearish posture.
The key change came yesterday when momentum slipped to the zero line. That move signaled a loss of trend. By the time we are writing this article, BMI has fallen below zero to -0.31. Today’s price action confirms the model’s warning that a drop toward zero is bearish, not merely a harmless pause.
This matters because the last two updates were accurate and well-timed. Two weeks ago, we noted that momentum was falling. One week ago, we highlighted that momentum remained weak but was still holding. That changed this week. The drop to the zero line was the sign to shift posture.
The Big Picture
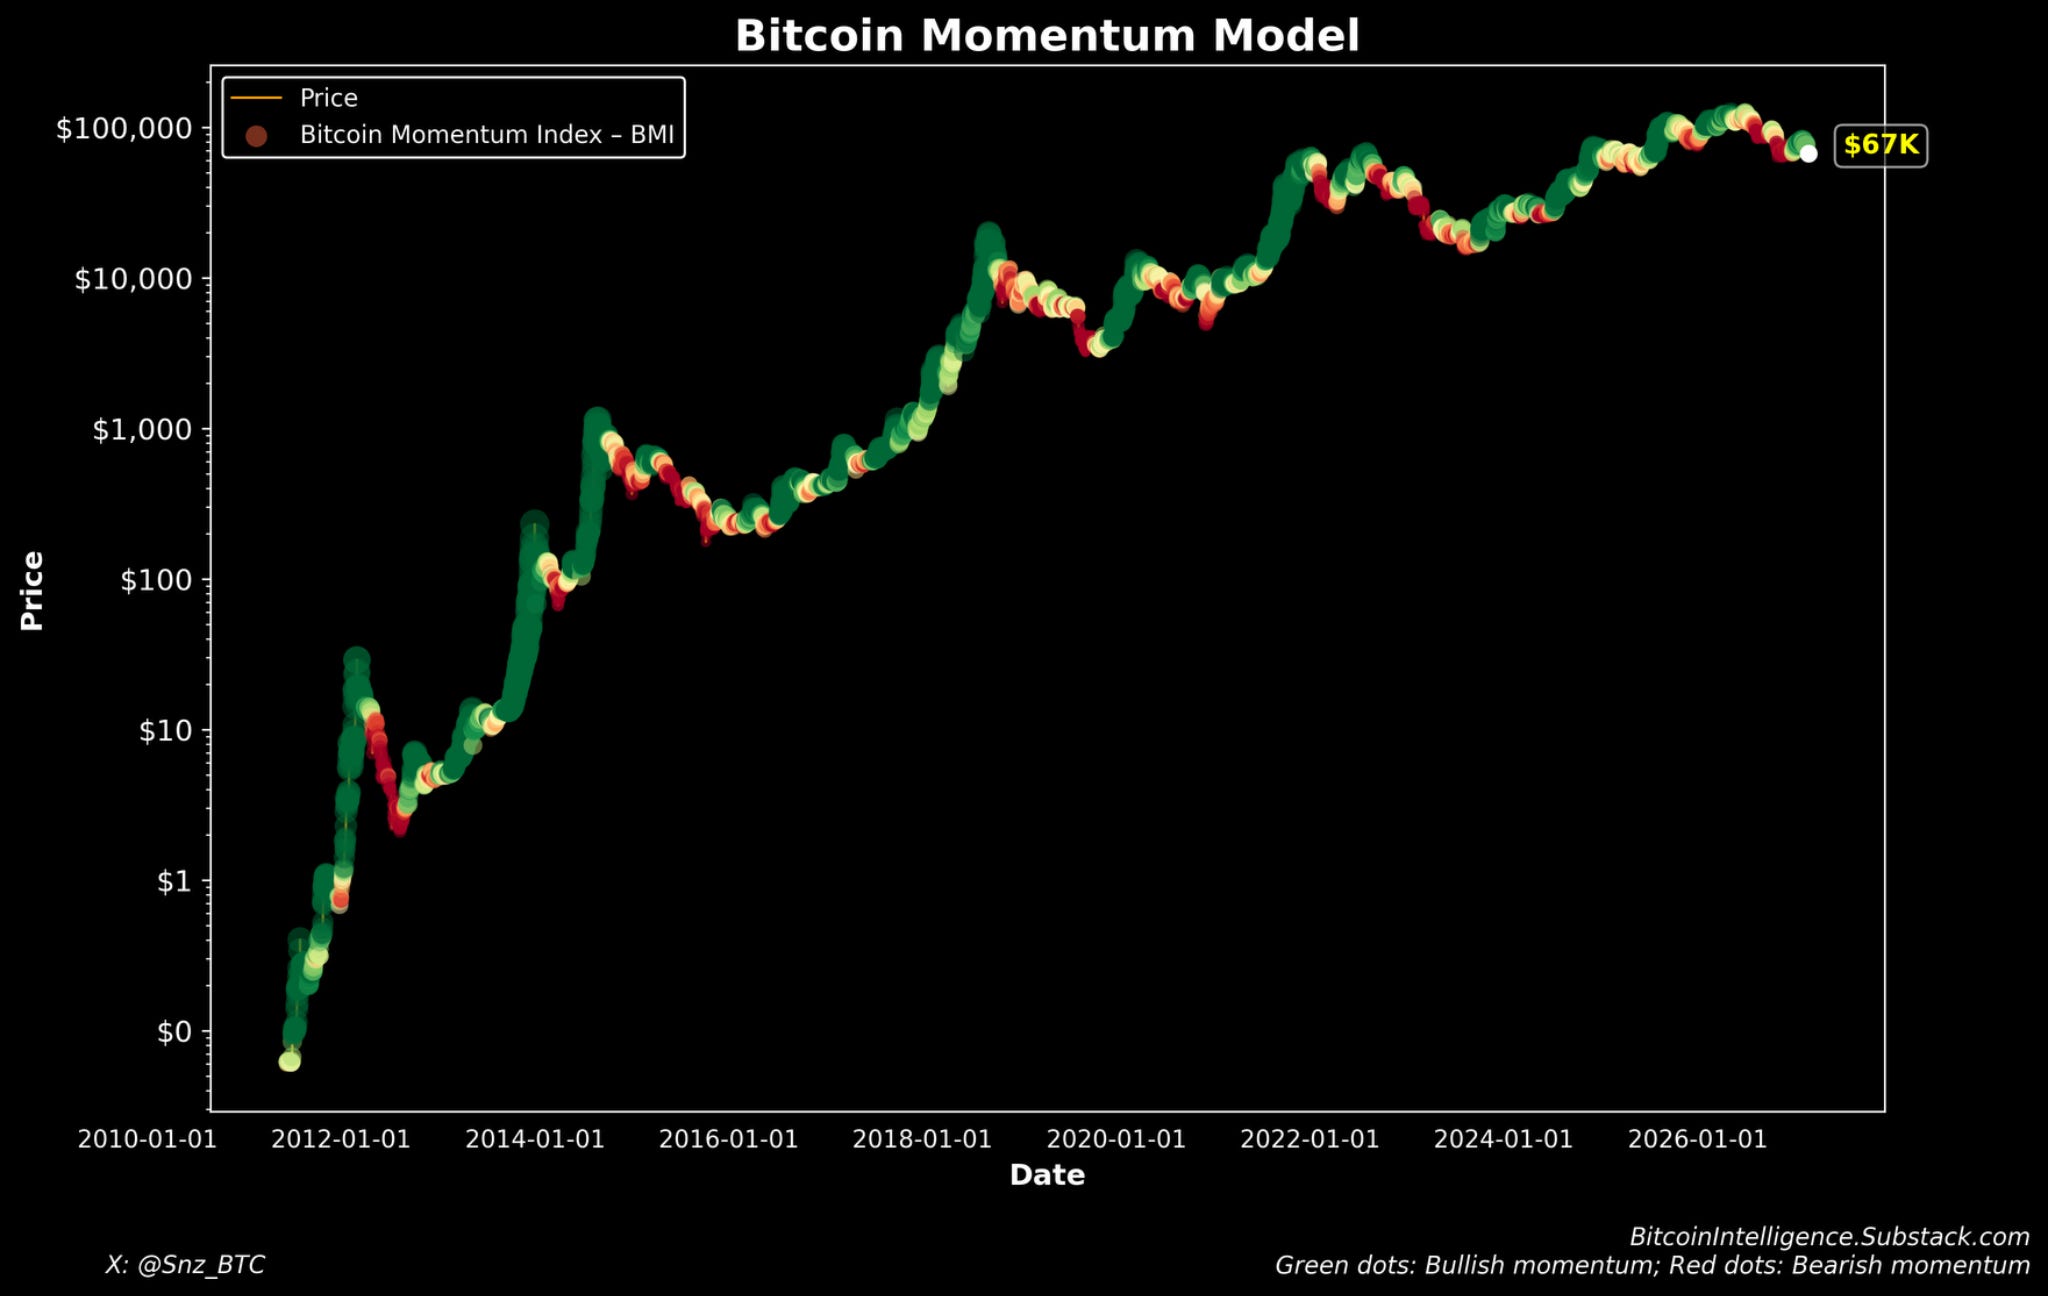
The full-history chart shows why this model is useful. Bitcoin’s strongest advances tend to persist while momentum remains positive. Its more damaging drawdowns often begin after momentum deteriorates and turns negative. The current reading is not the most extreme bearish reading in the model’s history, but it is enough to change the risk posture.
For a momentum system, the zero line matters more than the exact value. Above zero, the trend is intact. Near zero, the trend is fragile. Below zero, the default posture shifts to defense. That is where we are now.
The Current Cycle View
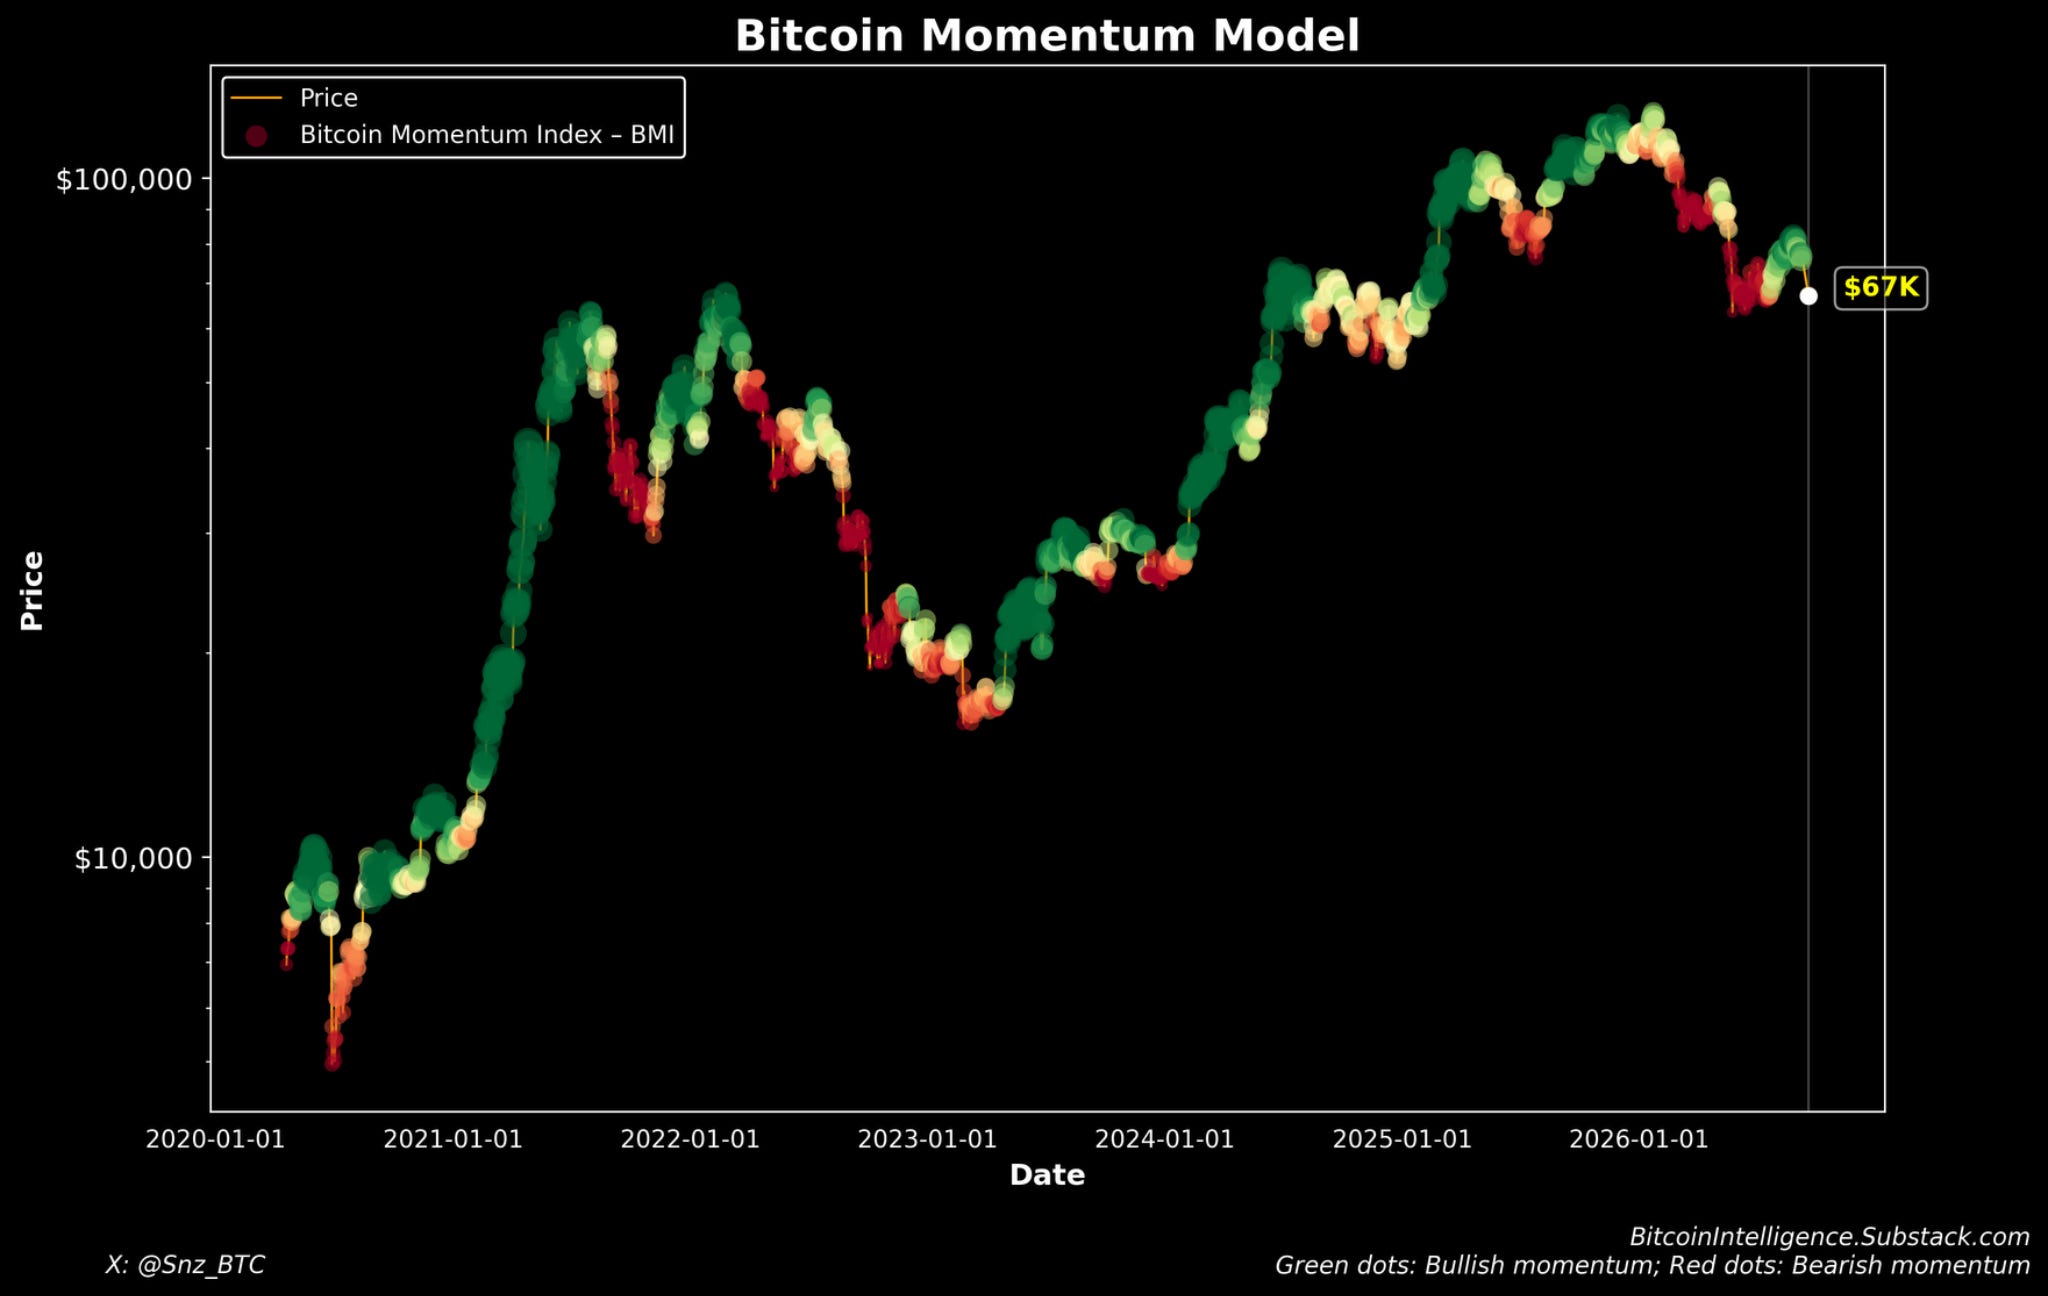
The current-cycle chart tells the same story in a more focused way. The model stayed mostly constructive during the stronger parts of the advance, then began flashing weaker signals as the market lost trend quality. The recent drop to $67K is not an isolated event. It follows a sequence of weakening momentum, failed recovery, and renewed bearish confirmation.
This is a good feature of the model: to avoid treating every bounce as a new bull market. In a volatile asset like Bitcoin, price alone can create false confidence. A short squeeze can look like accumulation. A reflexive bounce can look like a trend reversal. Momentum helps separate a durable regime shift from a temporary move.
The One-Year View: Weakness Turned Into a Break
