
Sustained Bearish Momentum
Bearish momentum deepens while valuation remains depressed

July 2026
Introduction
What a few weeks for Bitcoin. We navigated market volatility with high accuracy following momentum. The momentum model has been proving its value week after week in real time. We called the bearish momentum in our recent issues and avoided the crash.
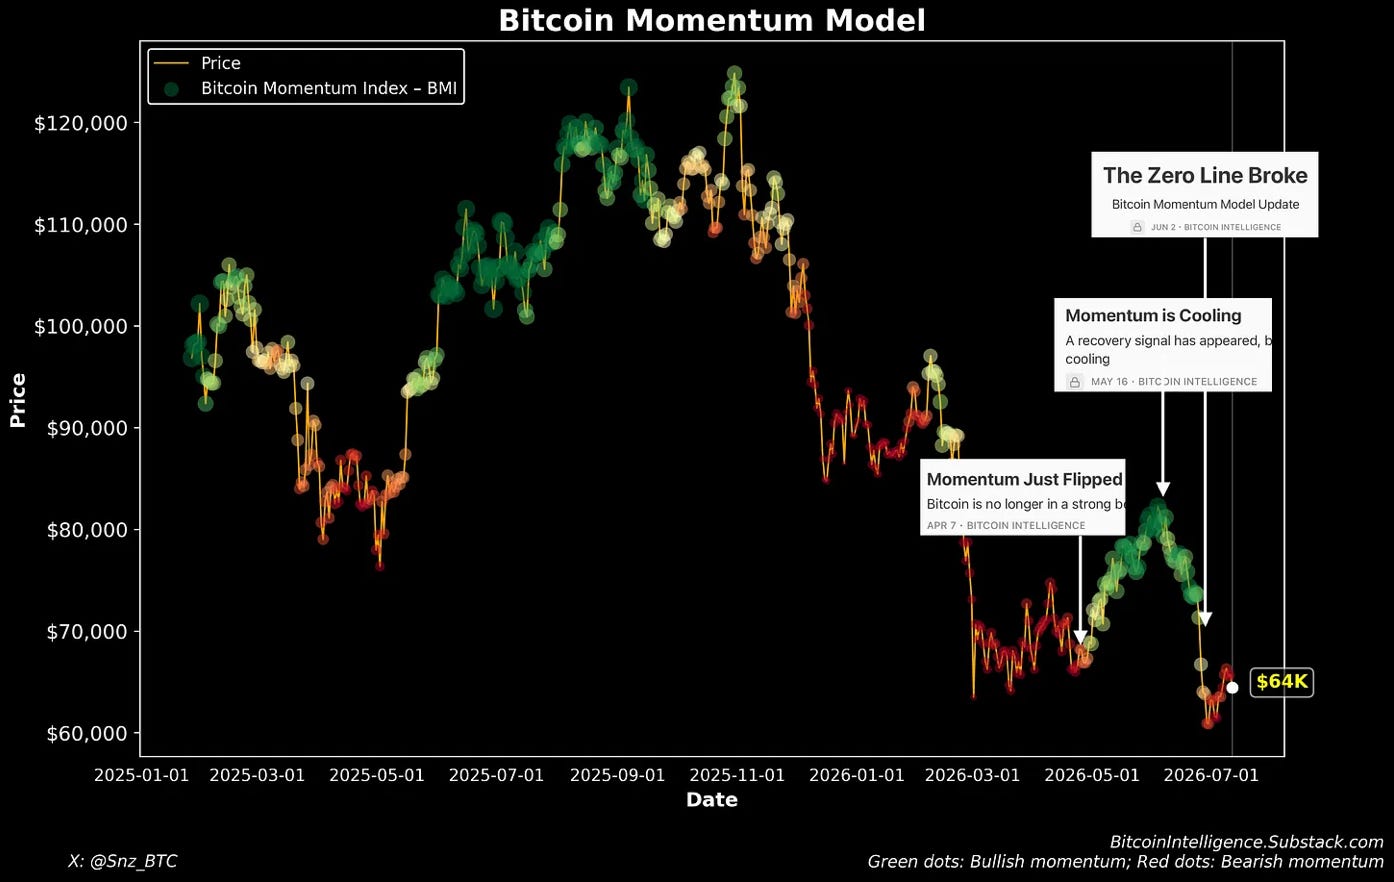
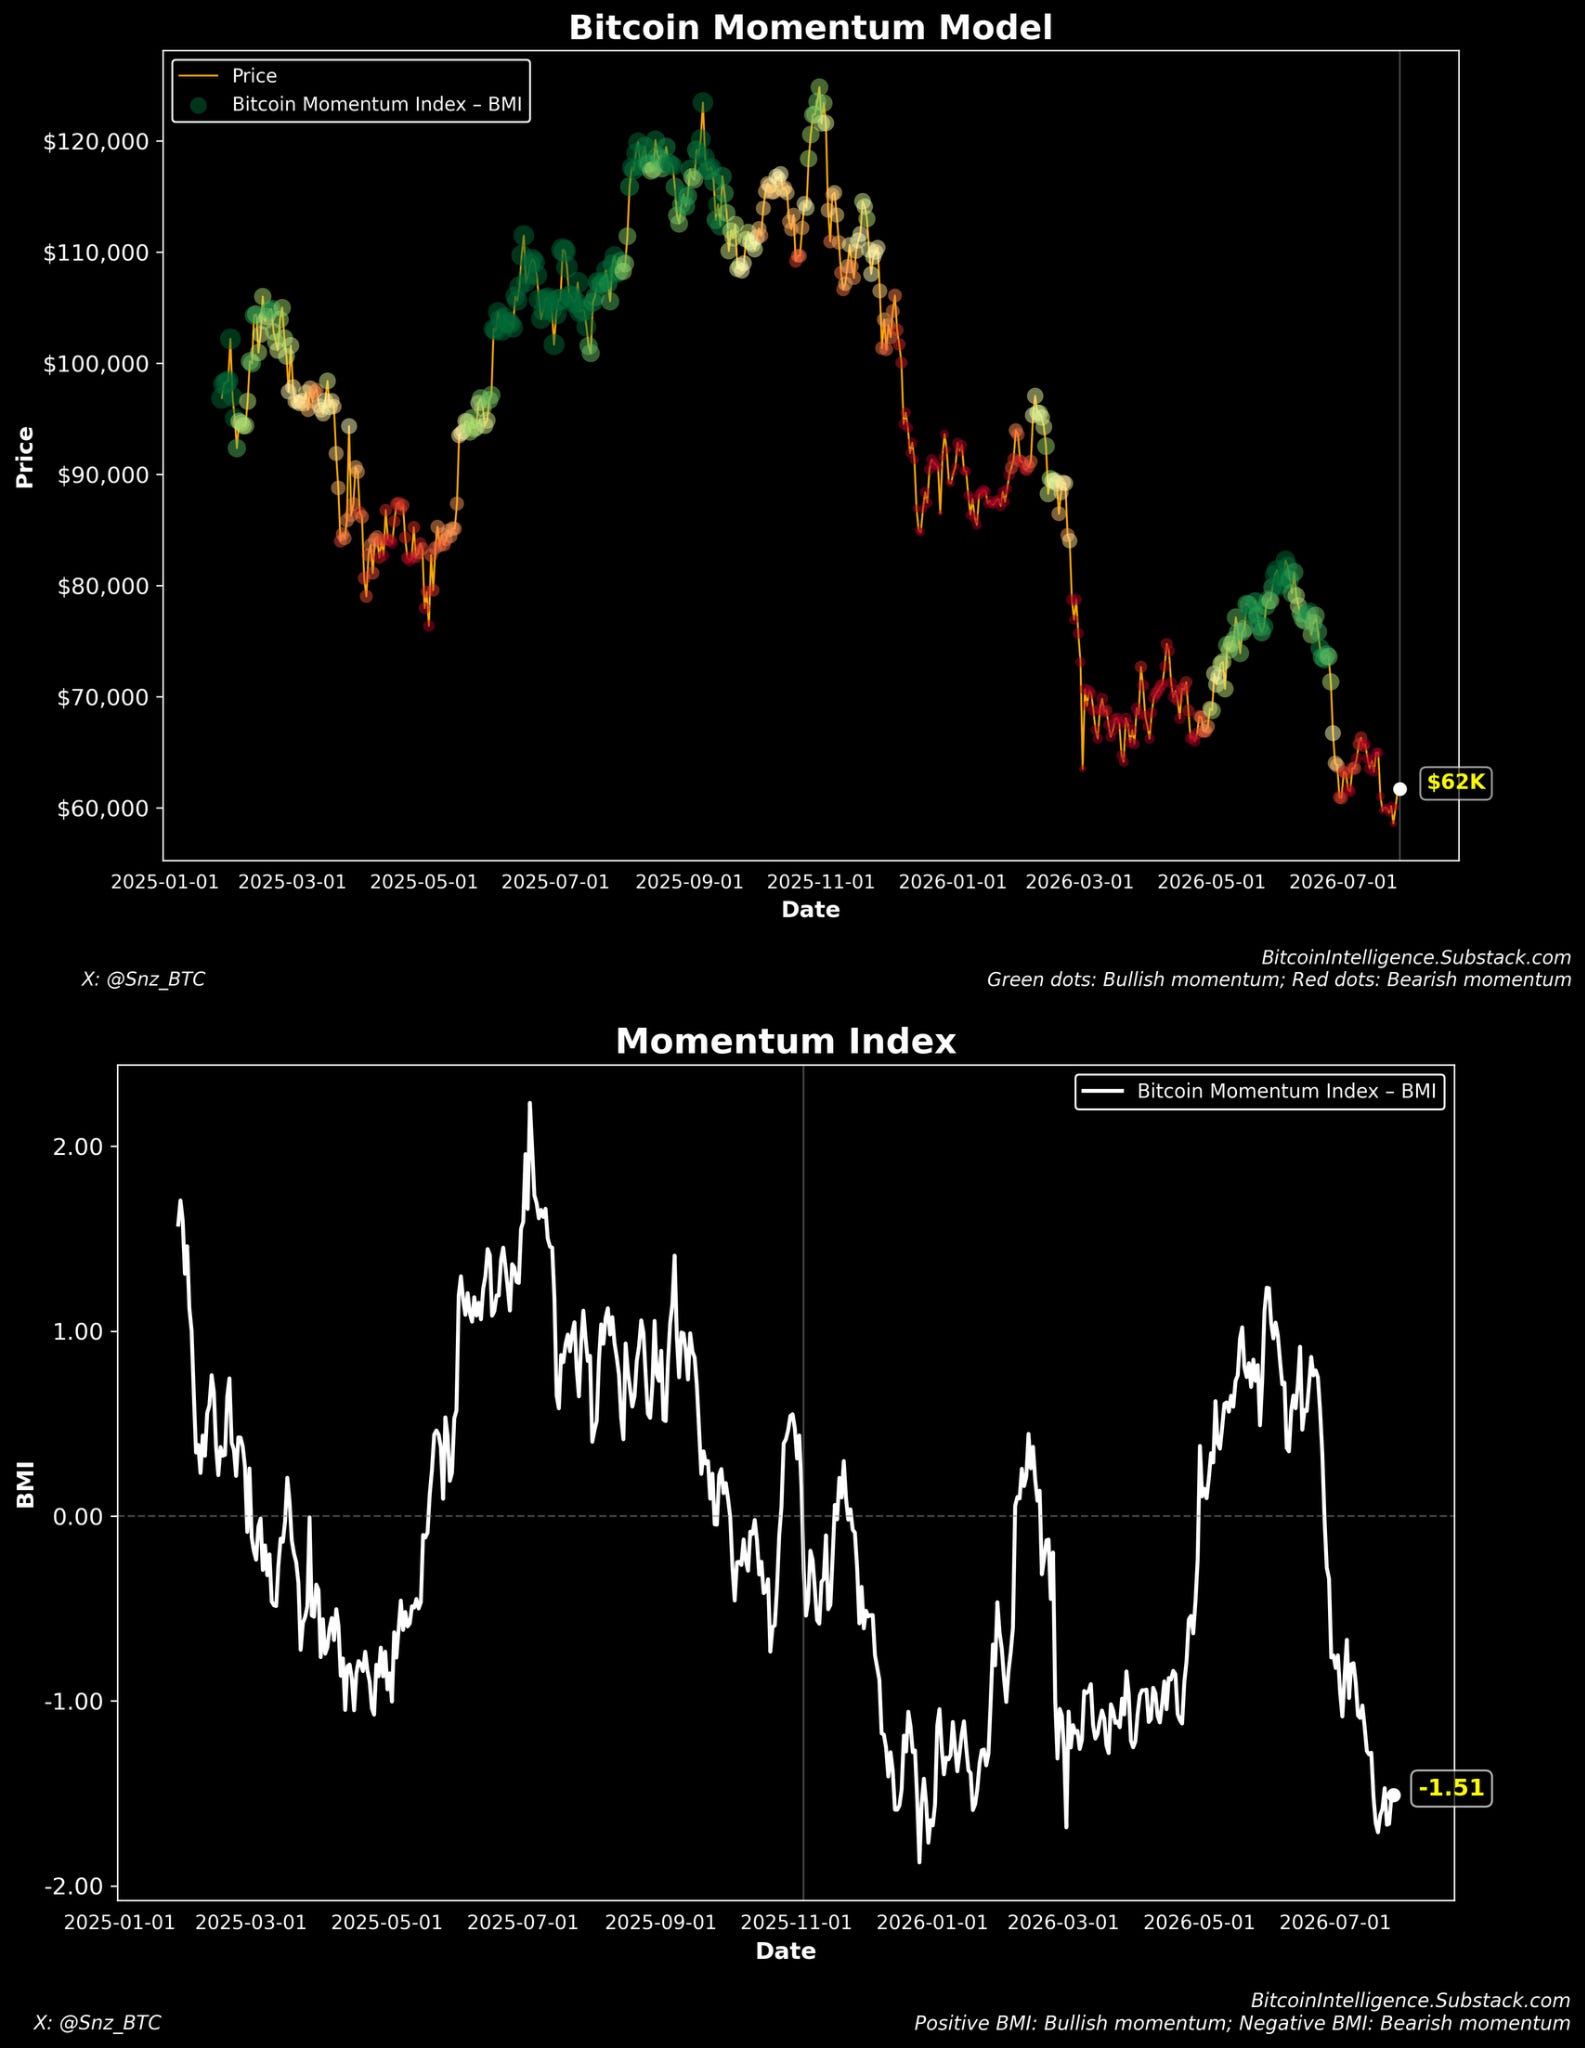
In our last issue on July 17th, we evaluated whether it was time to return to the market and revisited momentum. Bitcoin was trading around $64K, and the Bitcoin Momentum Index was still negative. Since then, as predicted, the market did not recover and instead dipped further. Price has slipped to around $62K, and the BMI has weakened further to approximately -1.51.
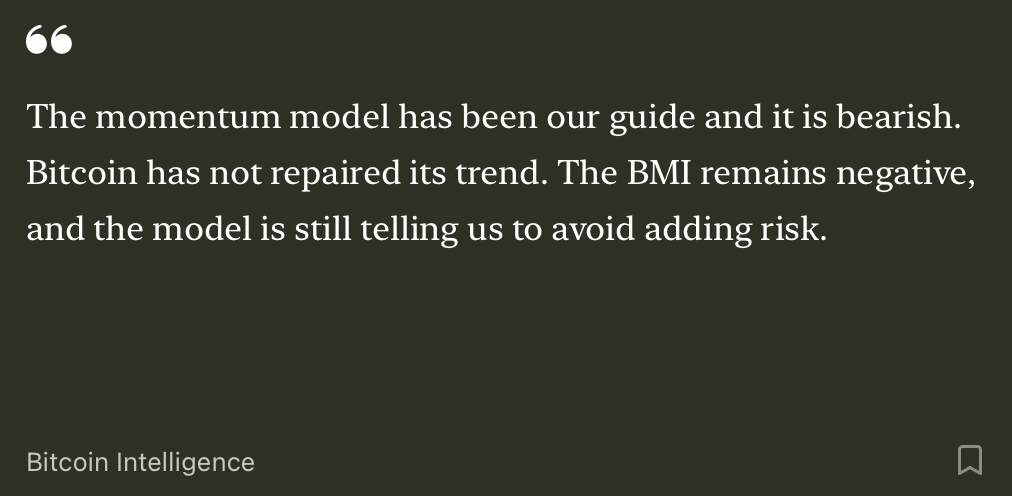
The Bitcoin Momentum Model converts recent price action into a simple regime signal. When momentum is positive, the model reads bullish. When momentum is negative, the model reads bearish. When momentum is near zero, the model treats the market as a transition zone. The model is designed to stay exposed during sustained uptrends and get defensive during sustained downtrends. Green means add or hold risk. Red means reduce risk or avoid adding. White or yellow means transition and caution.
The latest dots remain red to light red. Bitcoin is still sitting near the lower end of the recent range, and the model remains in a bearish regime. It is still a weak market trying to find footing.
The Longer-Term View
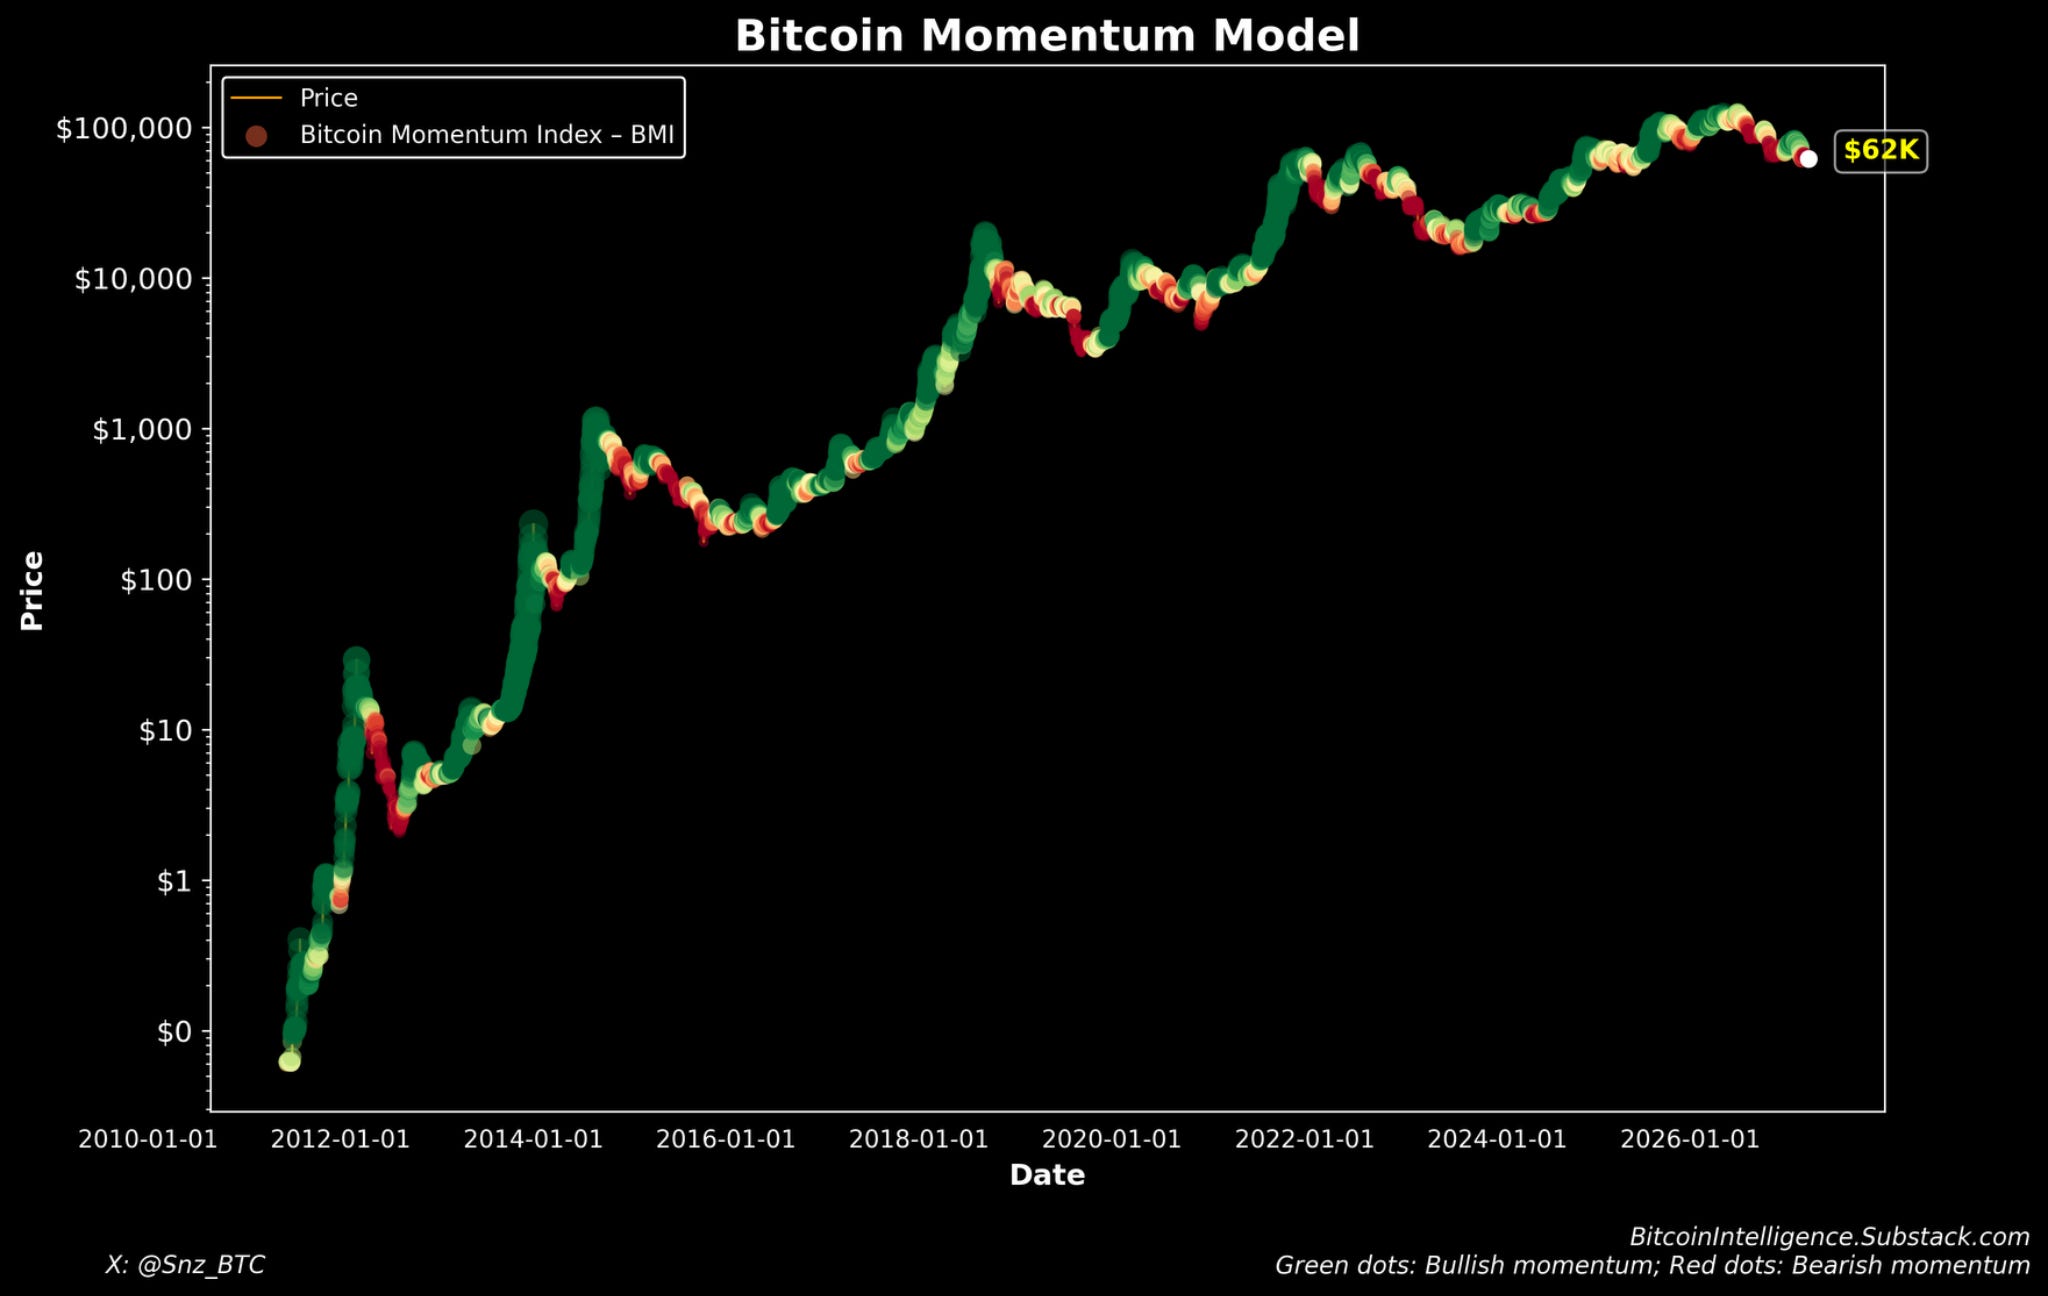
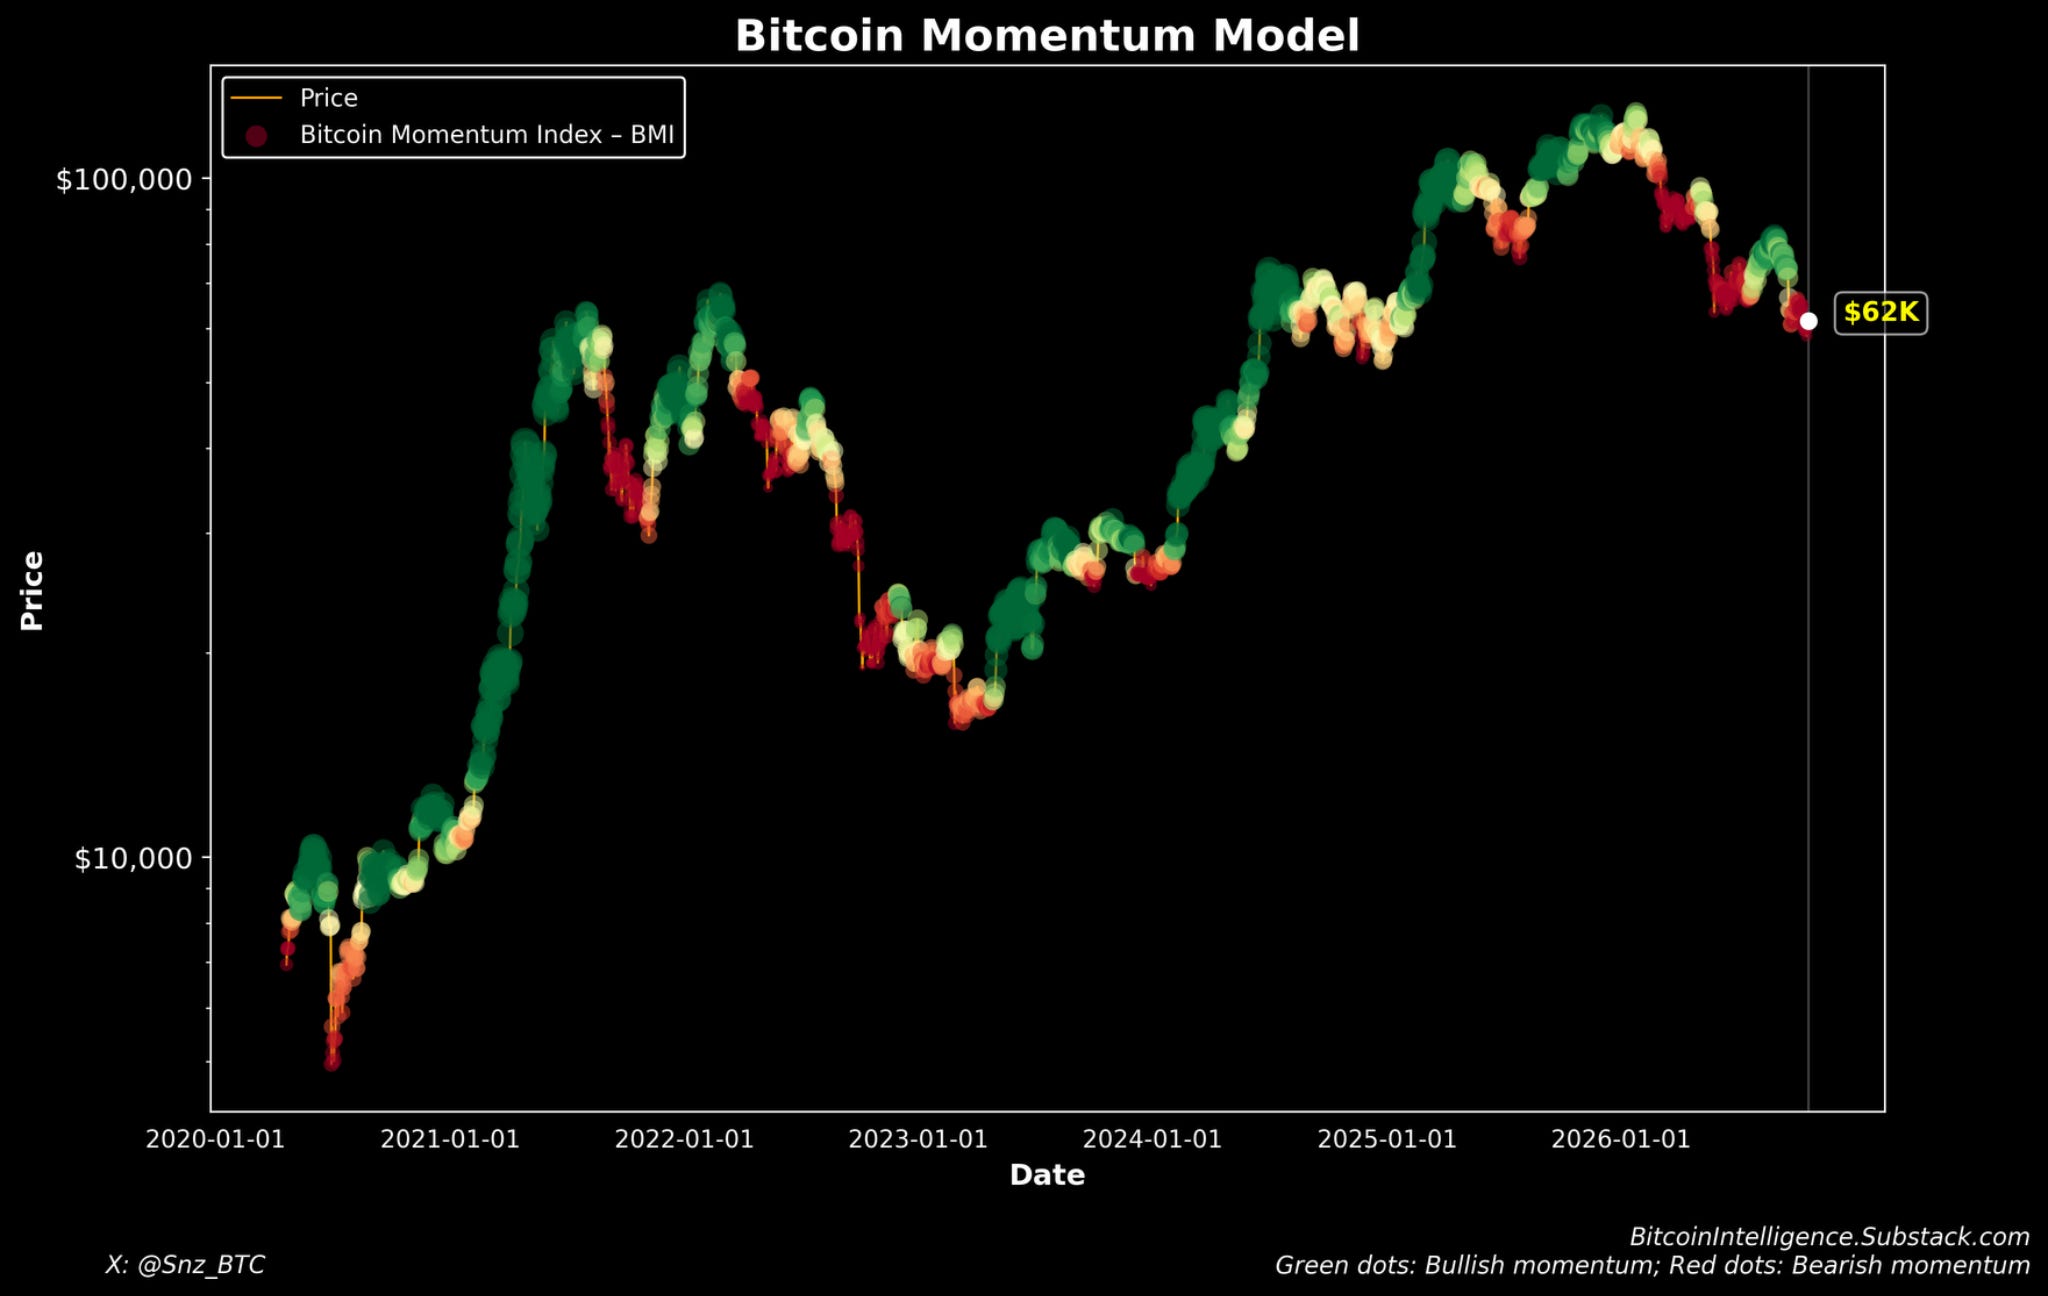
The full-history chart shows why the model is useful. Bitcoin can spend long periods in persistent regimes. Momentum does not need to predict every move to be valuable. It only needs to keep us aligned with the dominant trend and out of the most damaging bearish phases.
Over the full cycle, the latest dots are no longer green. They are red to light red near the current price label. That tells us the current weakness is not just daily noise. The broader momentum structure remains damaged.
The One-Year View
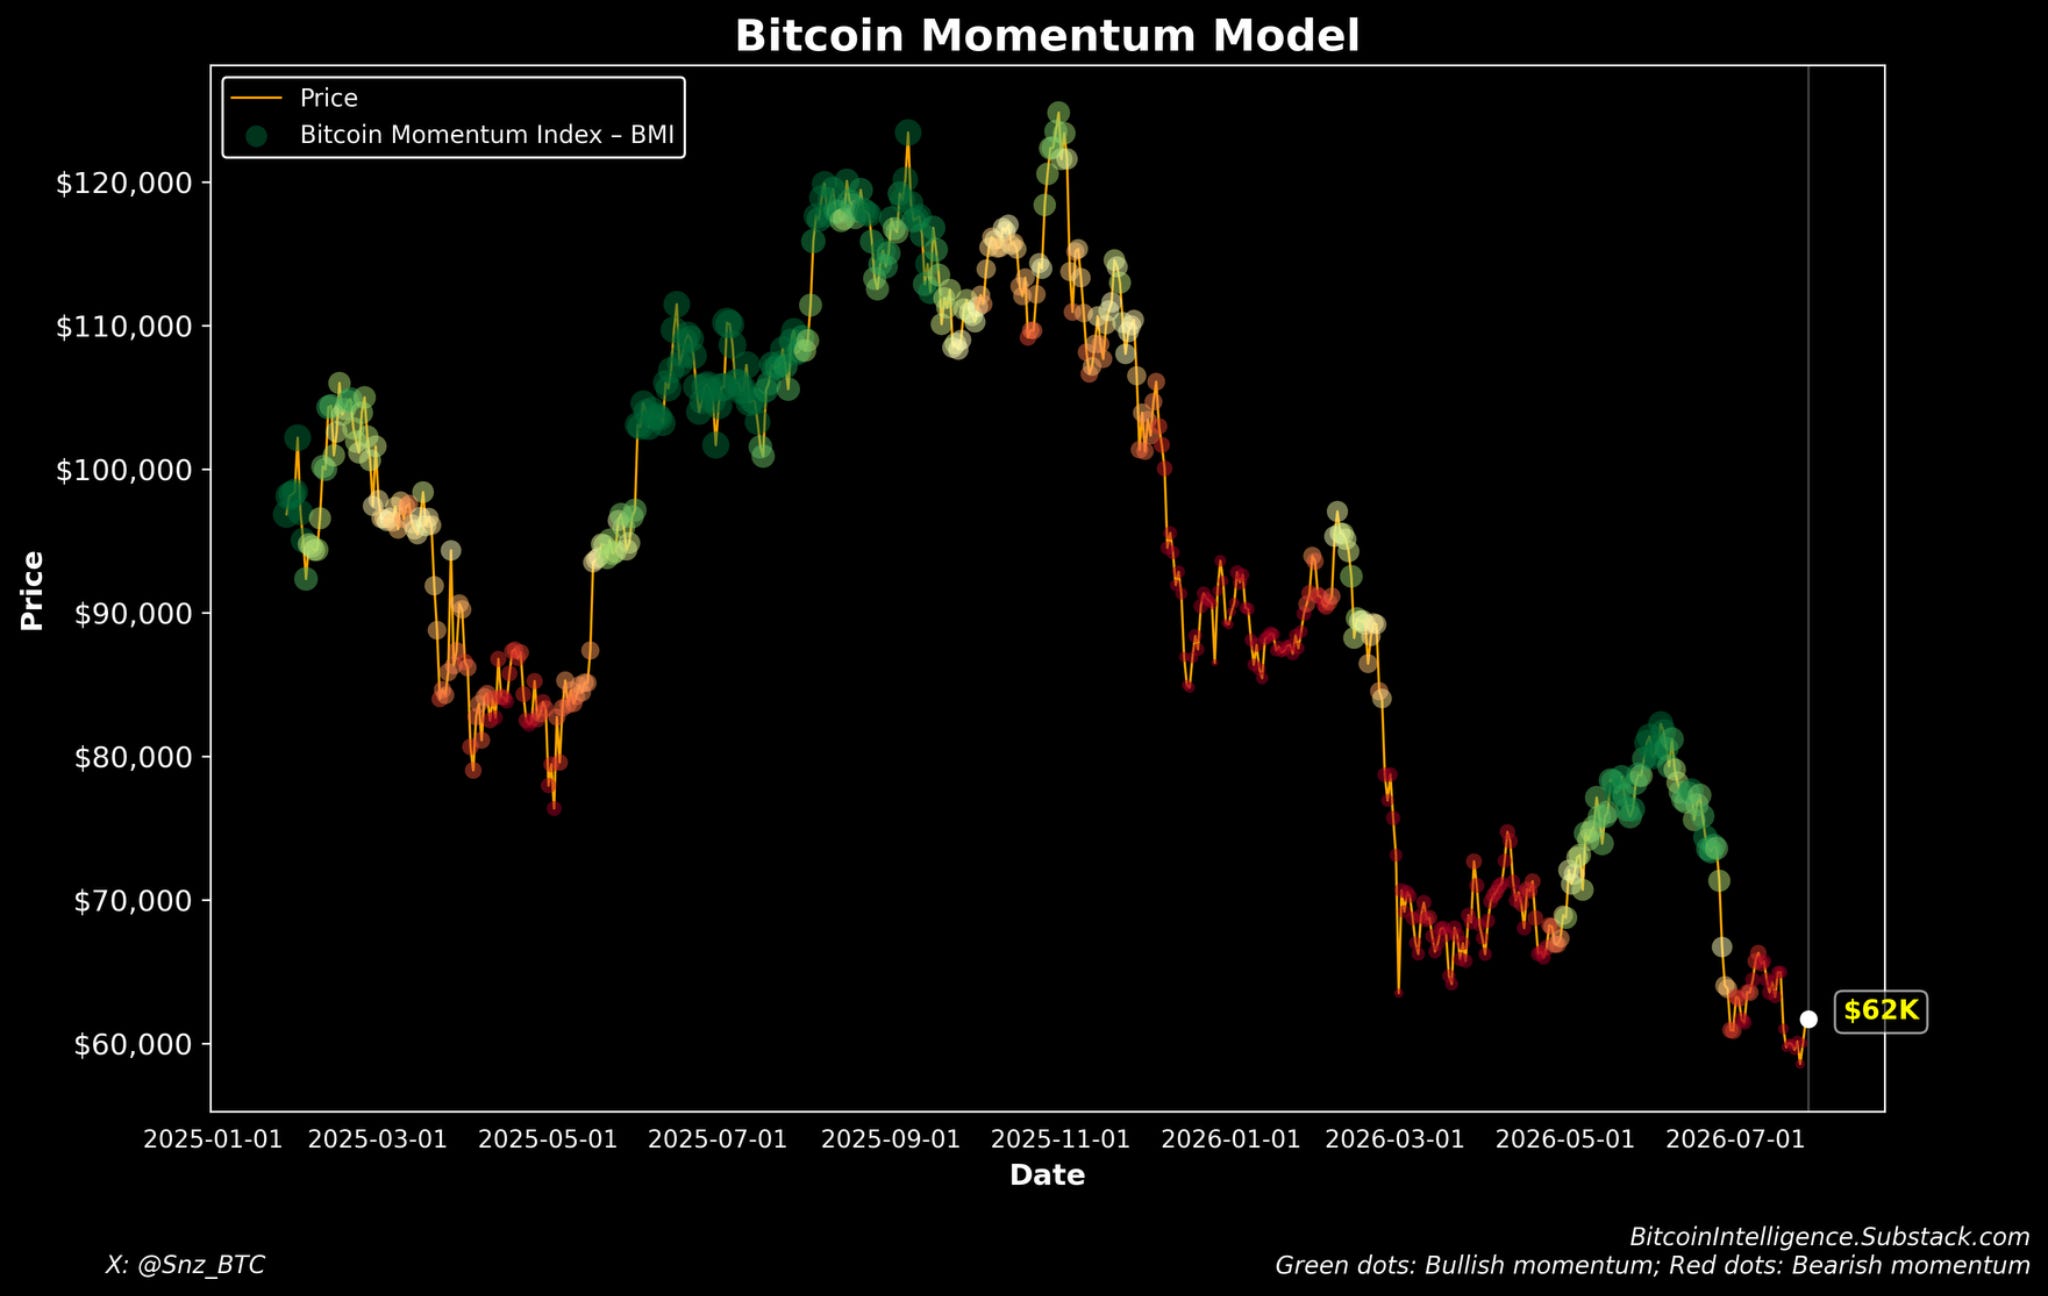
The one-year chart shows the deterioration clearly.
Bitcoin peaked above $120K, rolled over, and entered a prolonged bearish phase. The April and May rebound improved price temporarily, but that rally failed before the model could restore a durable bullish regime.
The latest move lower confirms the problem. Bitcoin has not only failed to reclaim the prior recovery range. It has also returned toward the lower end of the post-crash structure.
This is exactly where the momentum model matters. In a bearish market, every bounce can feel like the start of a new bull leg. The model keeps us from confusing a short-term bounce with a true regime shift.
Right now, the regime has not shifted.
