
Options Market: Structure Rebuilds After the Flush
The End-February Battlefield
Summary:
Last week was about rupture. This week is about reconstruction. The violent selloff that sliced through long-standing support levels forced a full repricing of risk across the derivatives complex. Implied volatility surged to crisis territory. Put skew reached multi-year extremes. Liquidations cascaded mechanically through the system. That phase was both emotional and structural, driven as much by forced positioning as by narrative.
What we are observing now is materially different. The panic bid has faded. Volatility has compressed from its extremes. Premium flow remains active but largely balanced. Open interest is layered rather than one-sided. Gamma exposure suggests conditional stability rather than persistent damping. In short, the market is no longer pricing immediate disorder, but it is not yet pricing sustained upside either. The market is no longer in free fall. Yet it is not in a confirmed uptrend.
Instead, it is rebuilding equilibrium around a defined core zone while carrying enough structural density that decisive moves can still accelerate. The positioning into February 20 provides near-term context, but the more important battlefield lies in the February 27 expiry, where open interest concentration and gamma sensitivity are most pronounced.
This is a market in recovery, not yet in resolution. The remainder of this report focuses primarily on the structure developing into the end of February and what it implies for price behavior over the coming weeks.
Premium Flow: Heavy Activity, Limited Conviction
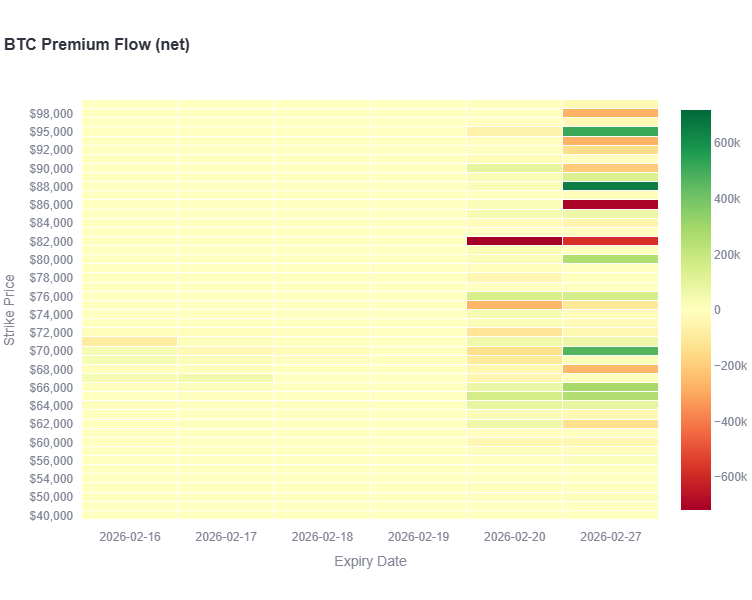
The most striking feature of this week’s premium flow is not direction, but balance. Gross premium turnover was substantial ~$42.8M on both the buy and sell side. Activity was broad across strikes and expiries, with meaningful participation concentrated in the February 27 tenor. Yet when netted, the resulting premium imbalance was small relative to the total volume traded (only ~-600k).
The net heatmap makes this clear. Most strikes sit close to neutral, particularly in the earlier February expiries. However, within February 27, localized pockets of imbalance emerge. There is visible net selling clustered around the low 80s, while net buying appears concentrated in the high 60s and low 70s. Higher strikes show selective upside participation, but not in overwhelming size.
This is not broad-based directional positioning. It is strike-specific redistribution. Calls and puts are both being actively traded, but flows are concentrated tactically rather than deployed uniformly. Traders appear to be constructing spreads, rolling exposure, and adjusting positioning around key levels rather than pressing for a clean breakout or collapse.
The 66k to 72k region stands out as the structural anchor of this repositioning. That corridor continues to attract activity, reinforcing its role as the market’s current equilibrium zone. Meanwhile, selective net selling above and selective net buying below suggest that participants are defining a range rather than betting on immediate expansion.
In short, the flow data does not reflect conviction. It reflects negotiation. Risk is being redistributed across strikes, particularly into end-February, without generating a decisive aggregate bias. That is consistent with a market transitioning from panic into structural rebuilding.
Open Interest: A Dense and Layered Battlefield
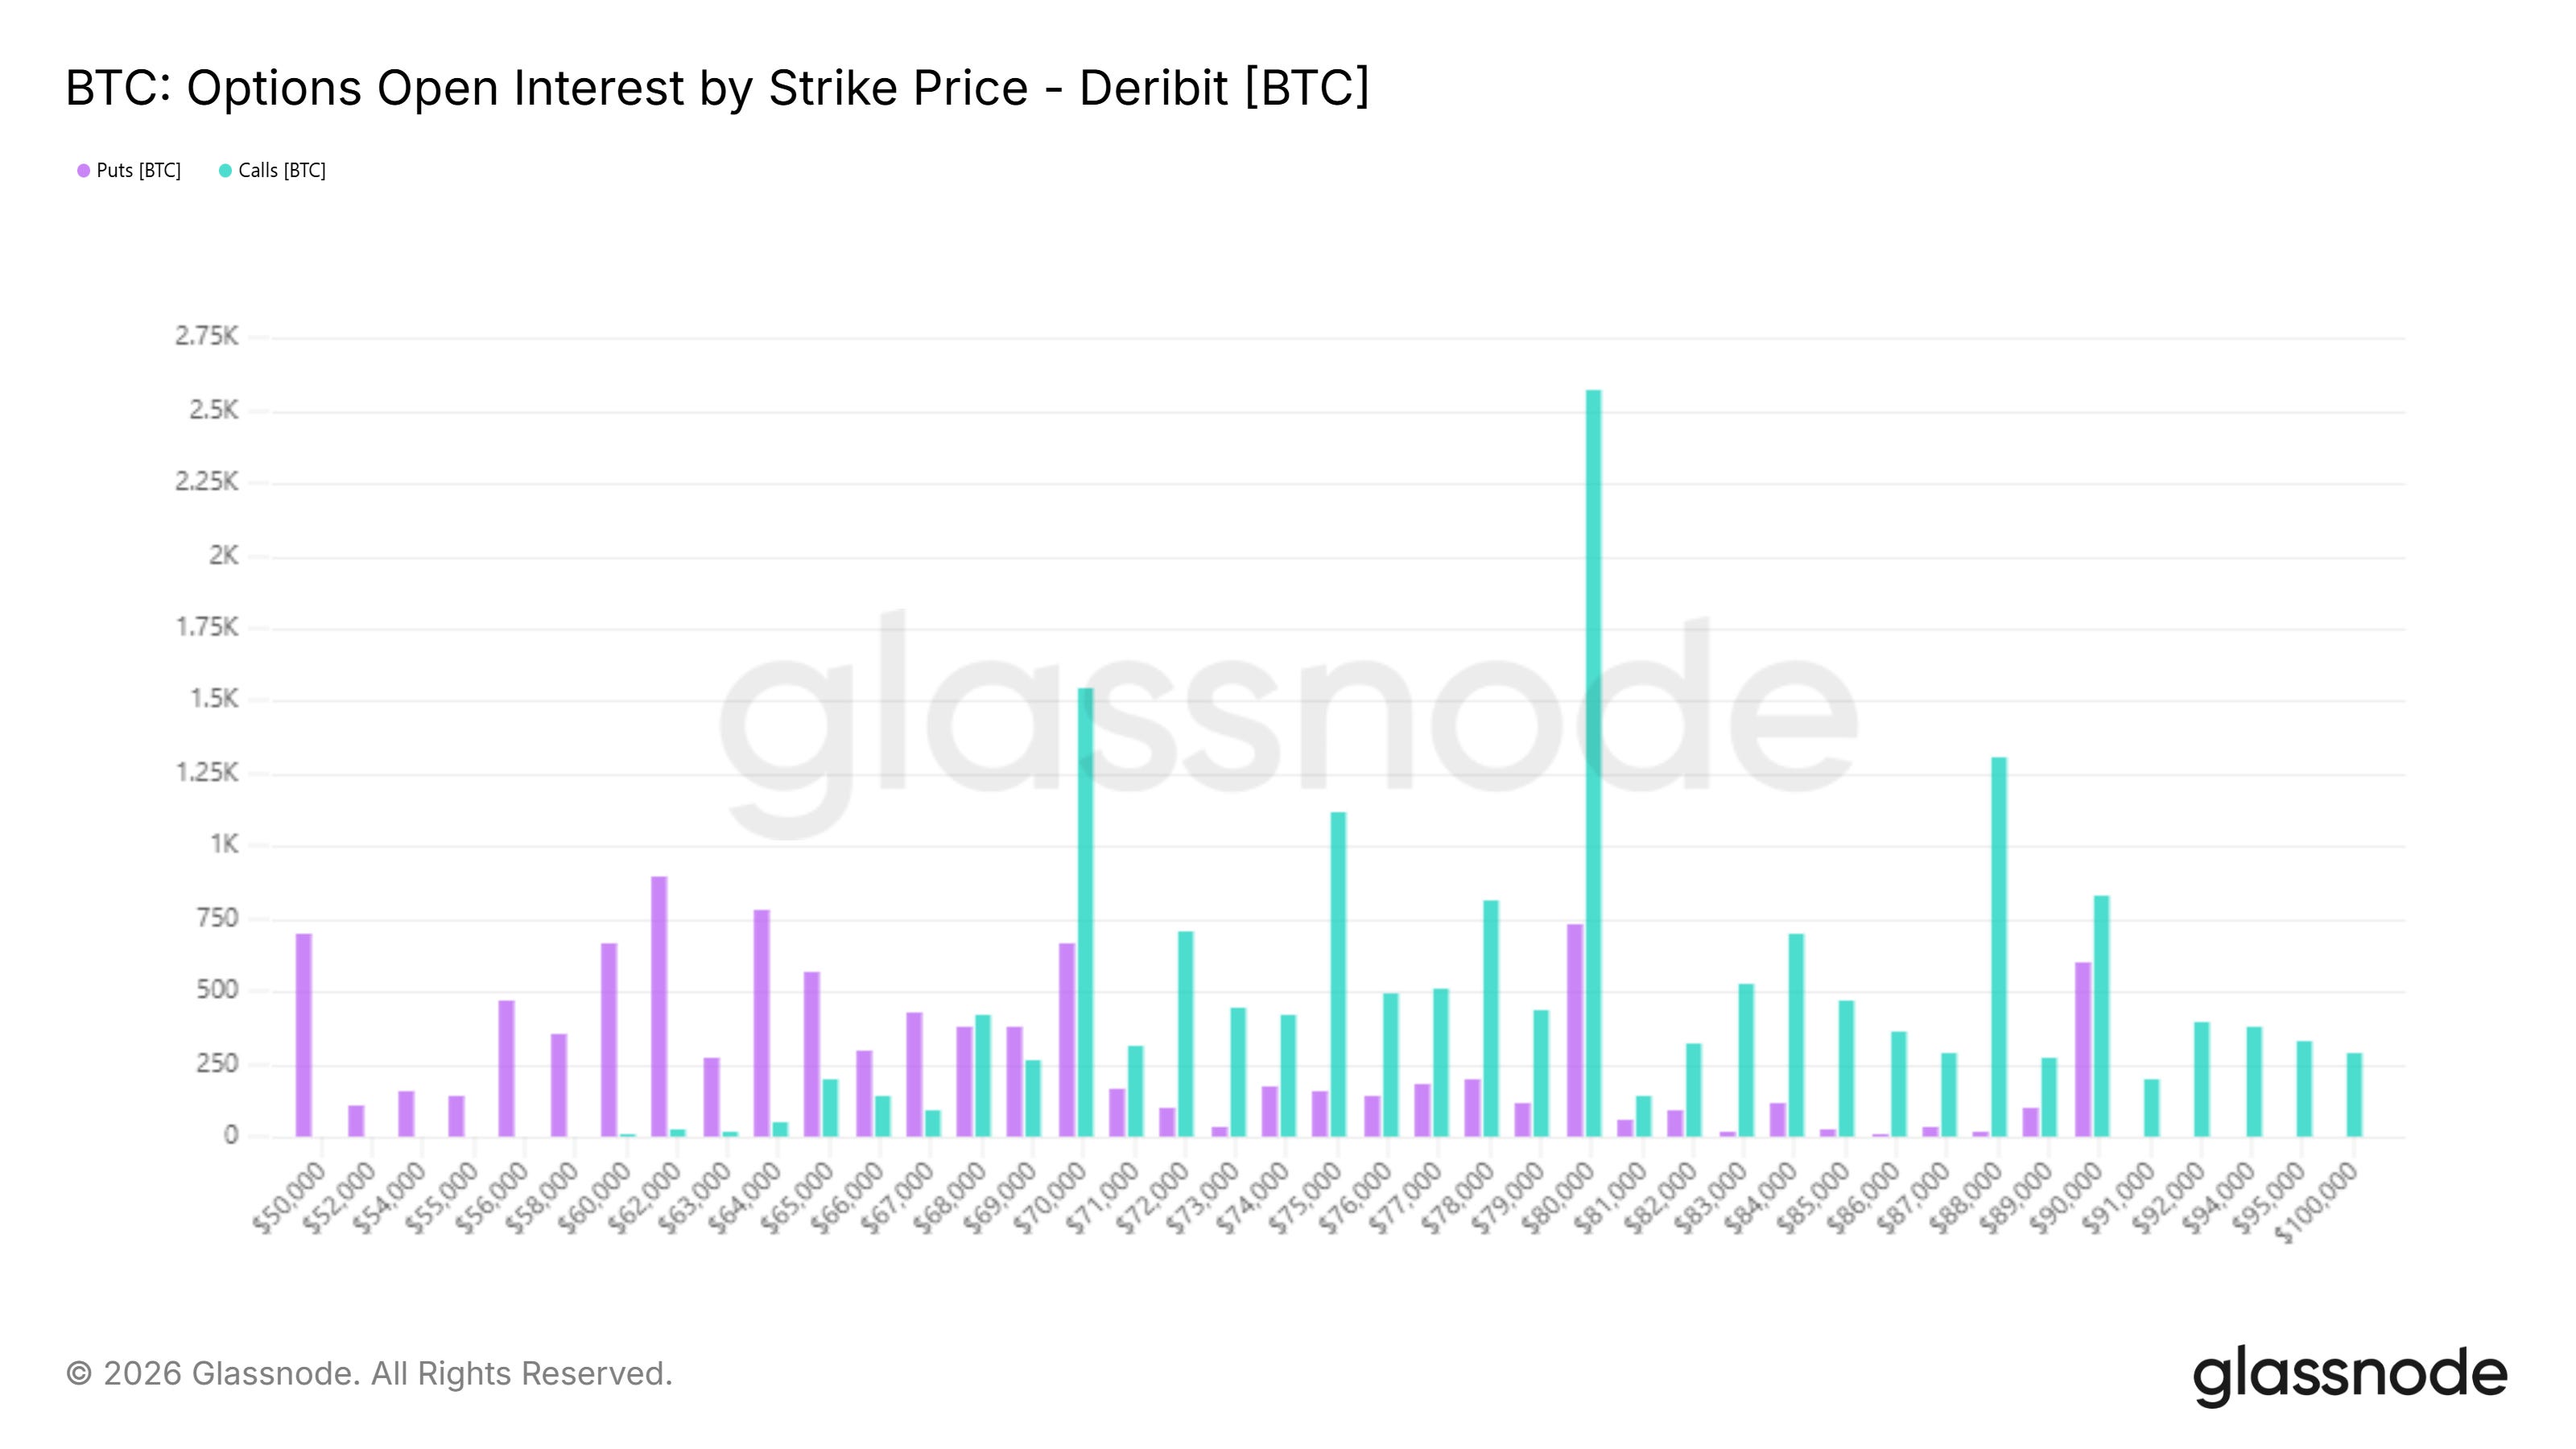
Open interest reveals where the risk now resides, and the current map is dense. For the February 20 expiry, 80k stands out as the most prominent call concentration. This strike carries substantial inventory and naturally functions as a mechanical focal point into expiry. However, the structure is not isolated to one strike. Meaningful call stacks are also present at 70k and 75k, while puts remain concentrated at 60k, 62k, and 70k.
This layered configuration reduces the likelihood of a simple single-strike pin dynamic. While 80k may exert gravitational pull, the path toward that level is shaped by surrounding inventory clusters that can either dampen or complicate movement.
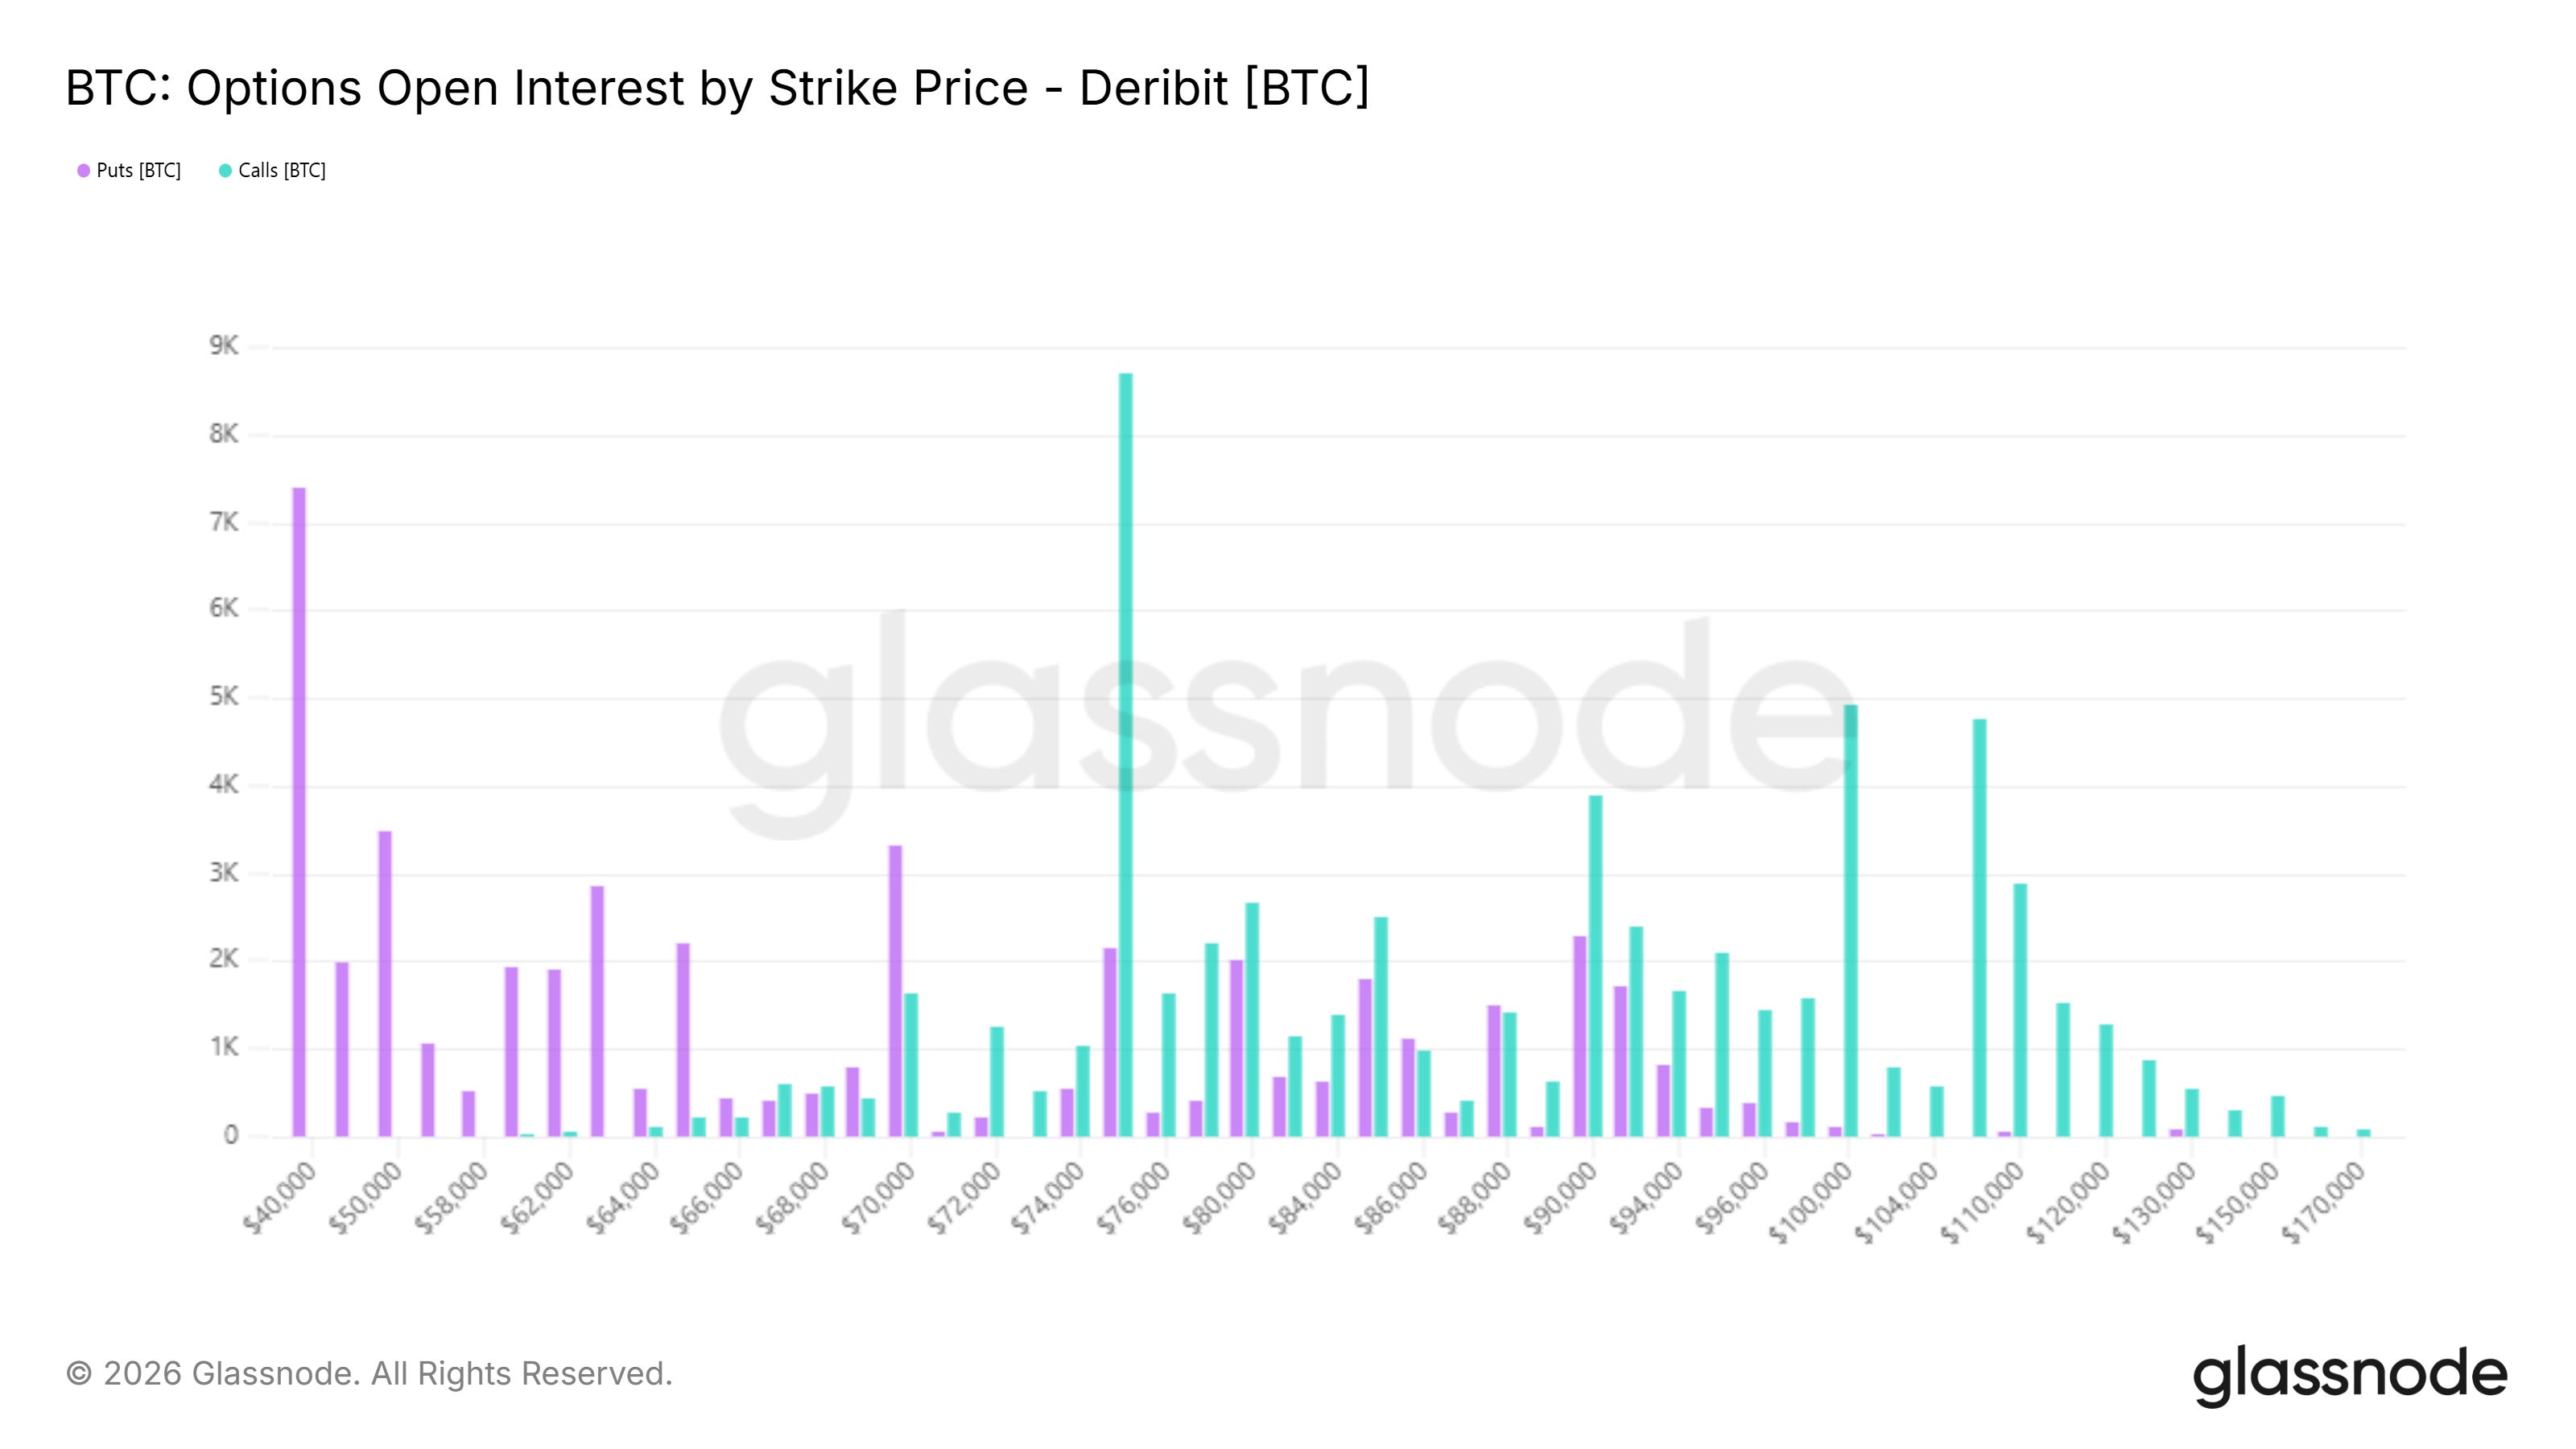
The more consequential expiry is February 27. The dominant structural feature is the 75k call strike, which materially exceeds other individual call concentrations. When a single strike becomes structurally dominant, it acquires mechanical importance. Hedging flows near that level can meaningfully influence price behavior, especially if spot begins to approach it from below.
Above 75k, call open interest is stacked across 80k, 85k, 90k, 100k, 105k, and 110k. This laddered upside positioning suggests that market participants are maintaining exposure to a broader recovery narrative. Upside convexity has not been abandoned.
On the downside, meaningful put inventory exists at 63k, 65k, and 70k, alongside deep tail protection at 40k and 50k. The presence of these lower strikes indicates that participants have not fully dismantled defensive positioning. Caution remains embedded in the structure.
The resulting configuration resembles a wide corridor. The 70k to 80k region functions as the structural core. Above it, convex upside exposure extends meaningfully. Below it, layered protection persists into the low 60s and deeper tails.
This is consistent with a post-panic regime where traders re-engage selectively without fully dropping hedges. The battlefield has widened, but it is still clearly defined.
Volatility: Compression Without Complacency
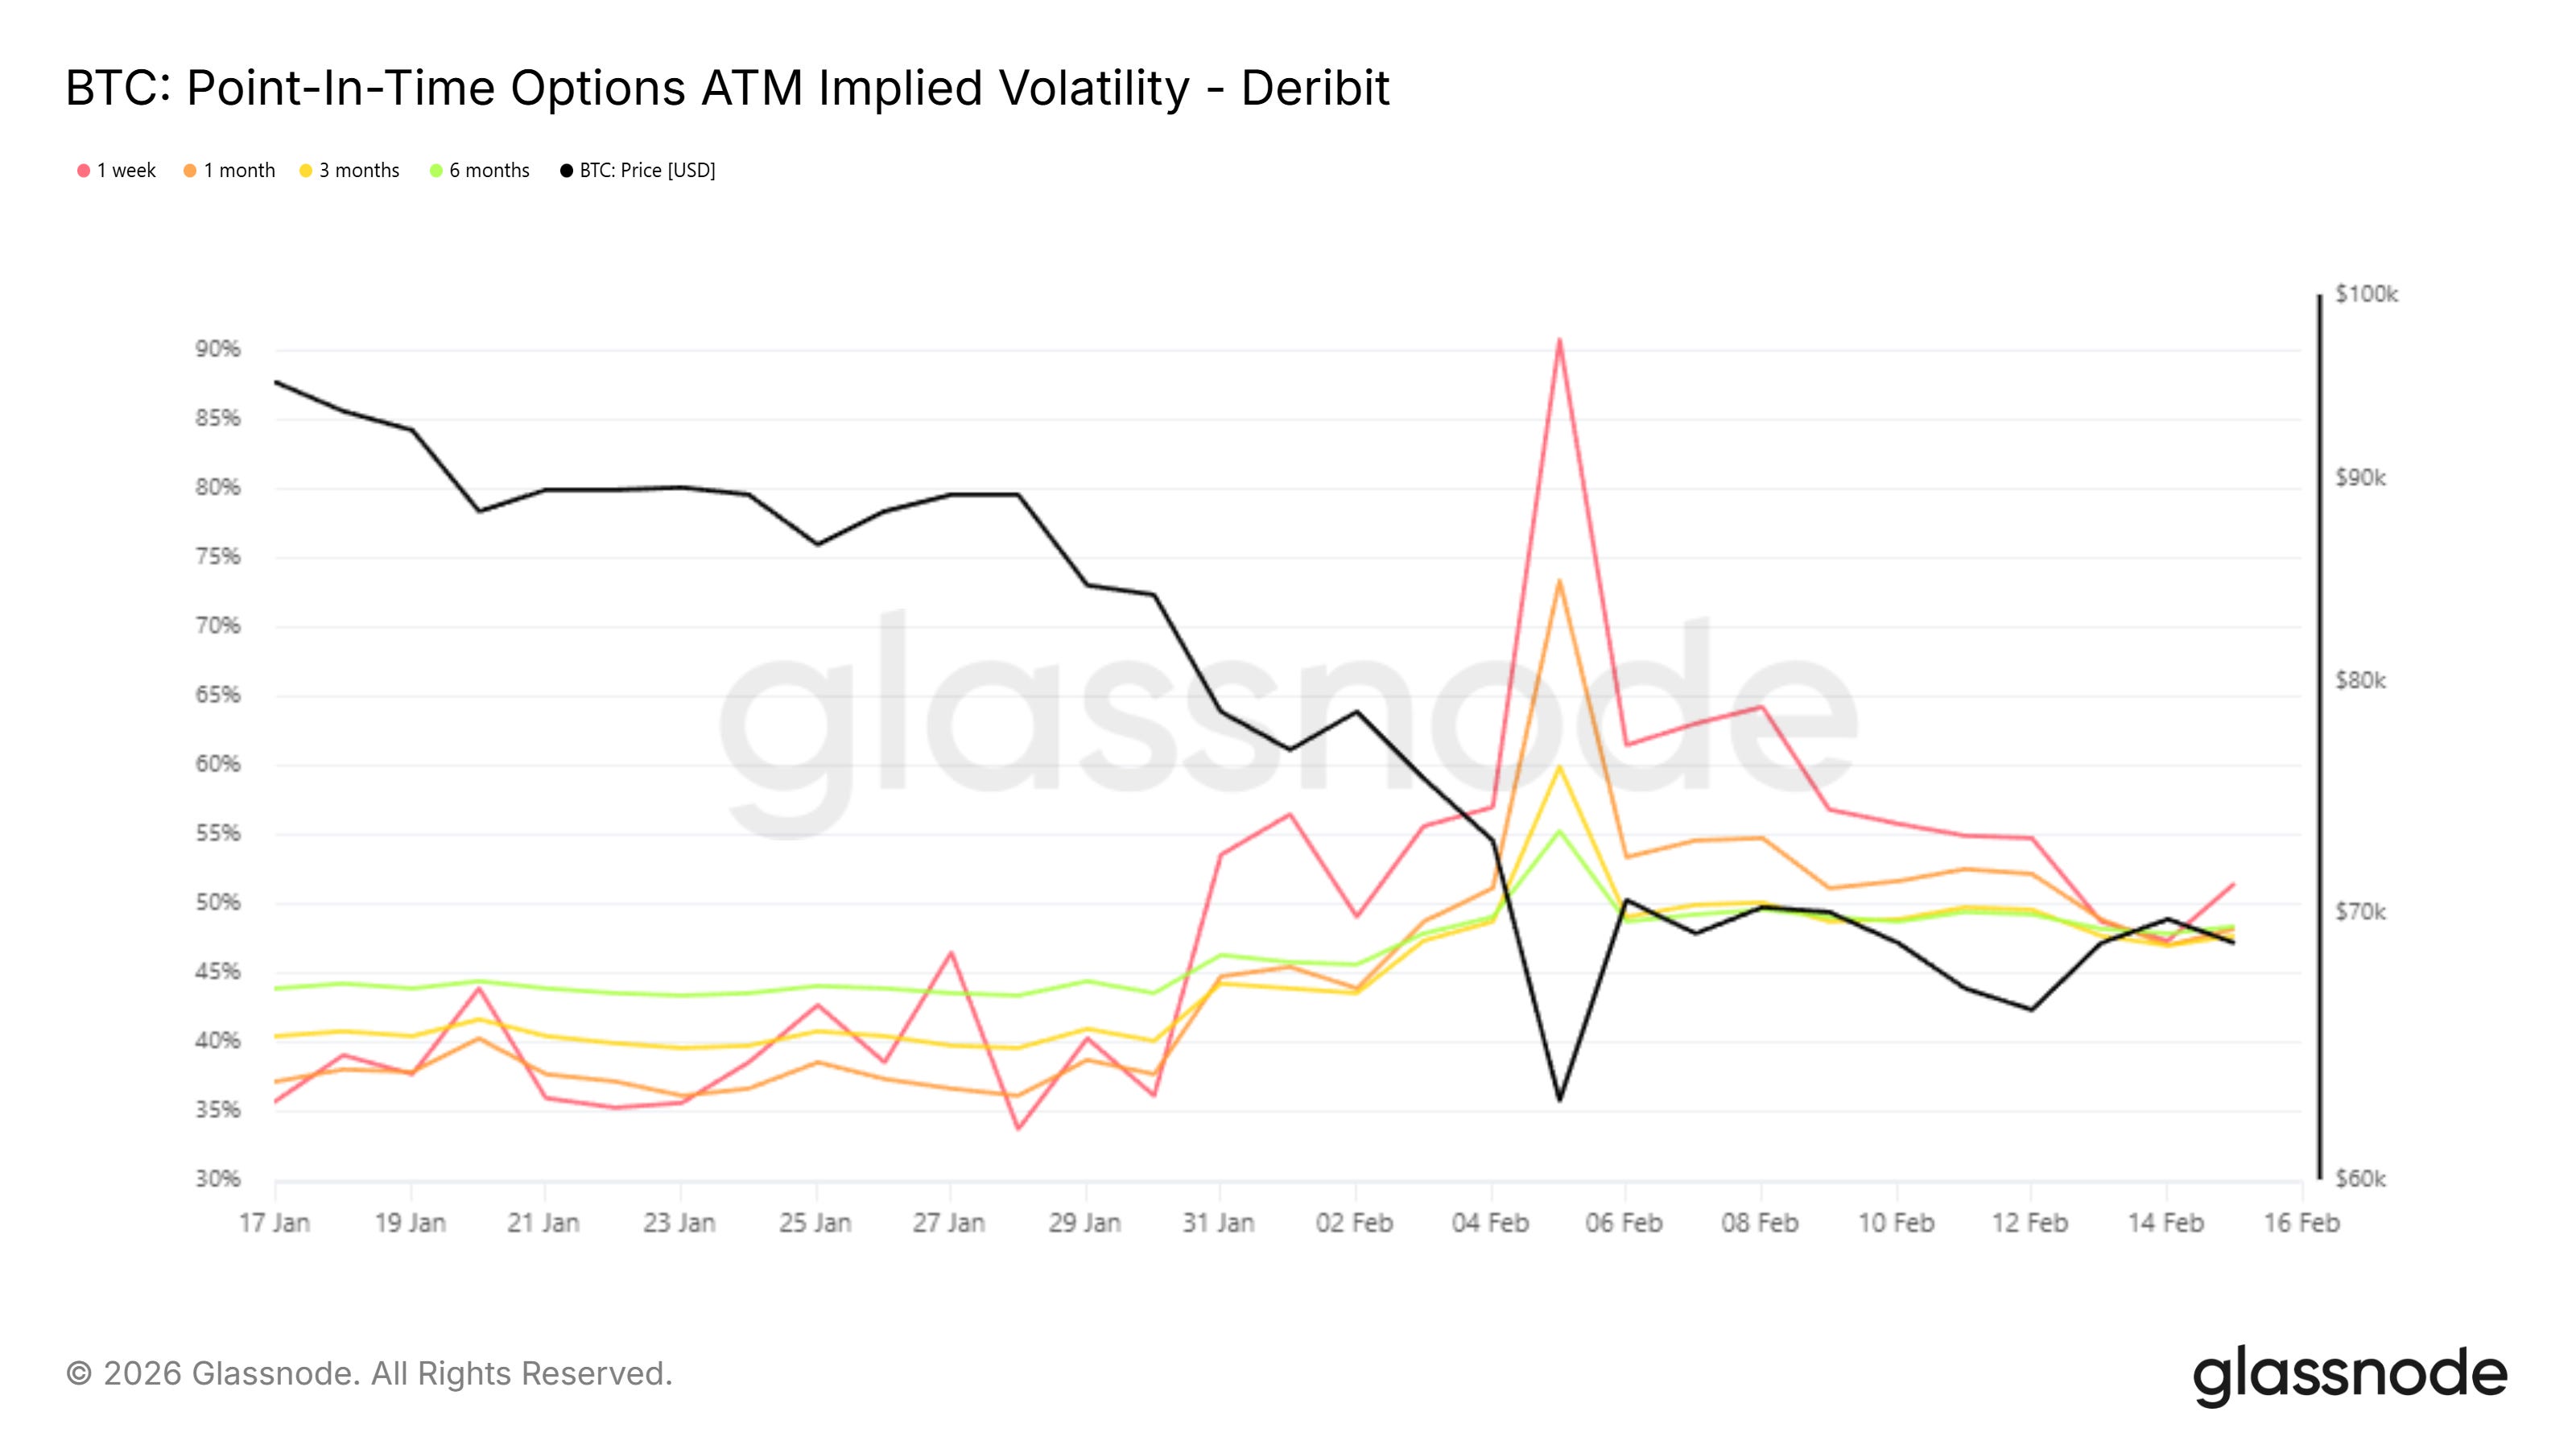
The volatility regime shift remains one of the most important developments of the week. During the selloff, front-end at-the-money implied volatility surged aggressively. Skew widened to crisis levels as participants paid up for downside convexity. The derivatives market was pricing urgent disorder.
That extreme pricing has moderated. At-the-money volatility has retraced from its highs. The term structure has normalized from panic-driven inversion. Skew has relaxed from its most distorted levels, reflecting reduced urgency for crash protection.
However, volatility is not low. It remains elevated relative to calm bull market regimes. This distinction matters. Elevated but compressing volatility often signals a market in transition rather than resolution. The immediate fear has passed, but uncertainty persists. In such environments, structured volatility selling strategies tend to re-emerge, particularly when participants believe forced liquidation risk has diminished.
This dynamic aligns with the modest net put selling observed in premium flow. At the same time, elevated volatility leaves room for rapid re-expansion if price momentum re-accelerates. The market is no longer pricing imminent collapse, but it is also not pricing tranquility. Volatility has shifted from crisis to tension.
Gamma Exposure: Structural Fragility Below, Stabilization Above
Gamma exposure determines how the market mechanically responds to price movement. When dealers are positioned long gamma, their hedging activity dampens volatility. They sell into strength and buy into weakness, encouraging mean reversion and reducing the likelihood of runaway moves. When dealers are positioned short gamma, the opposite occurs. They must hedge in the direction of price. Rallies force buying. Selloffs force selling. Momentum becomes self-reinforcing.
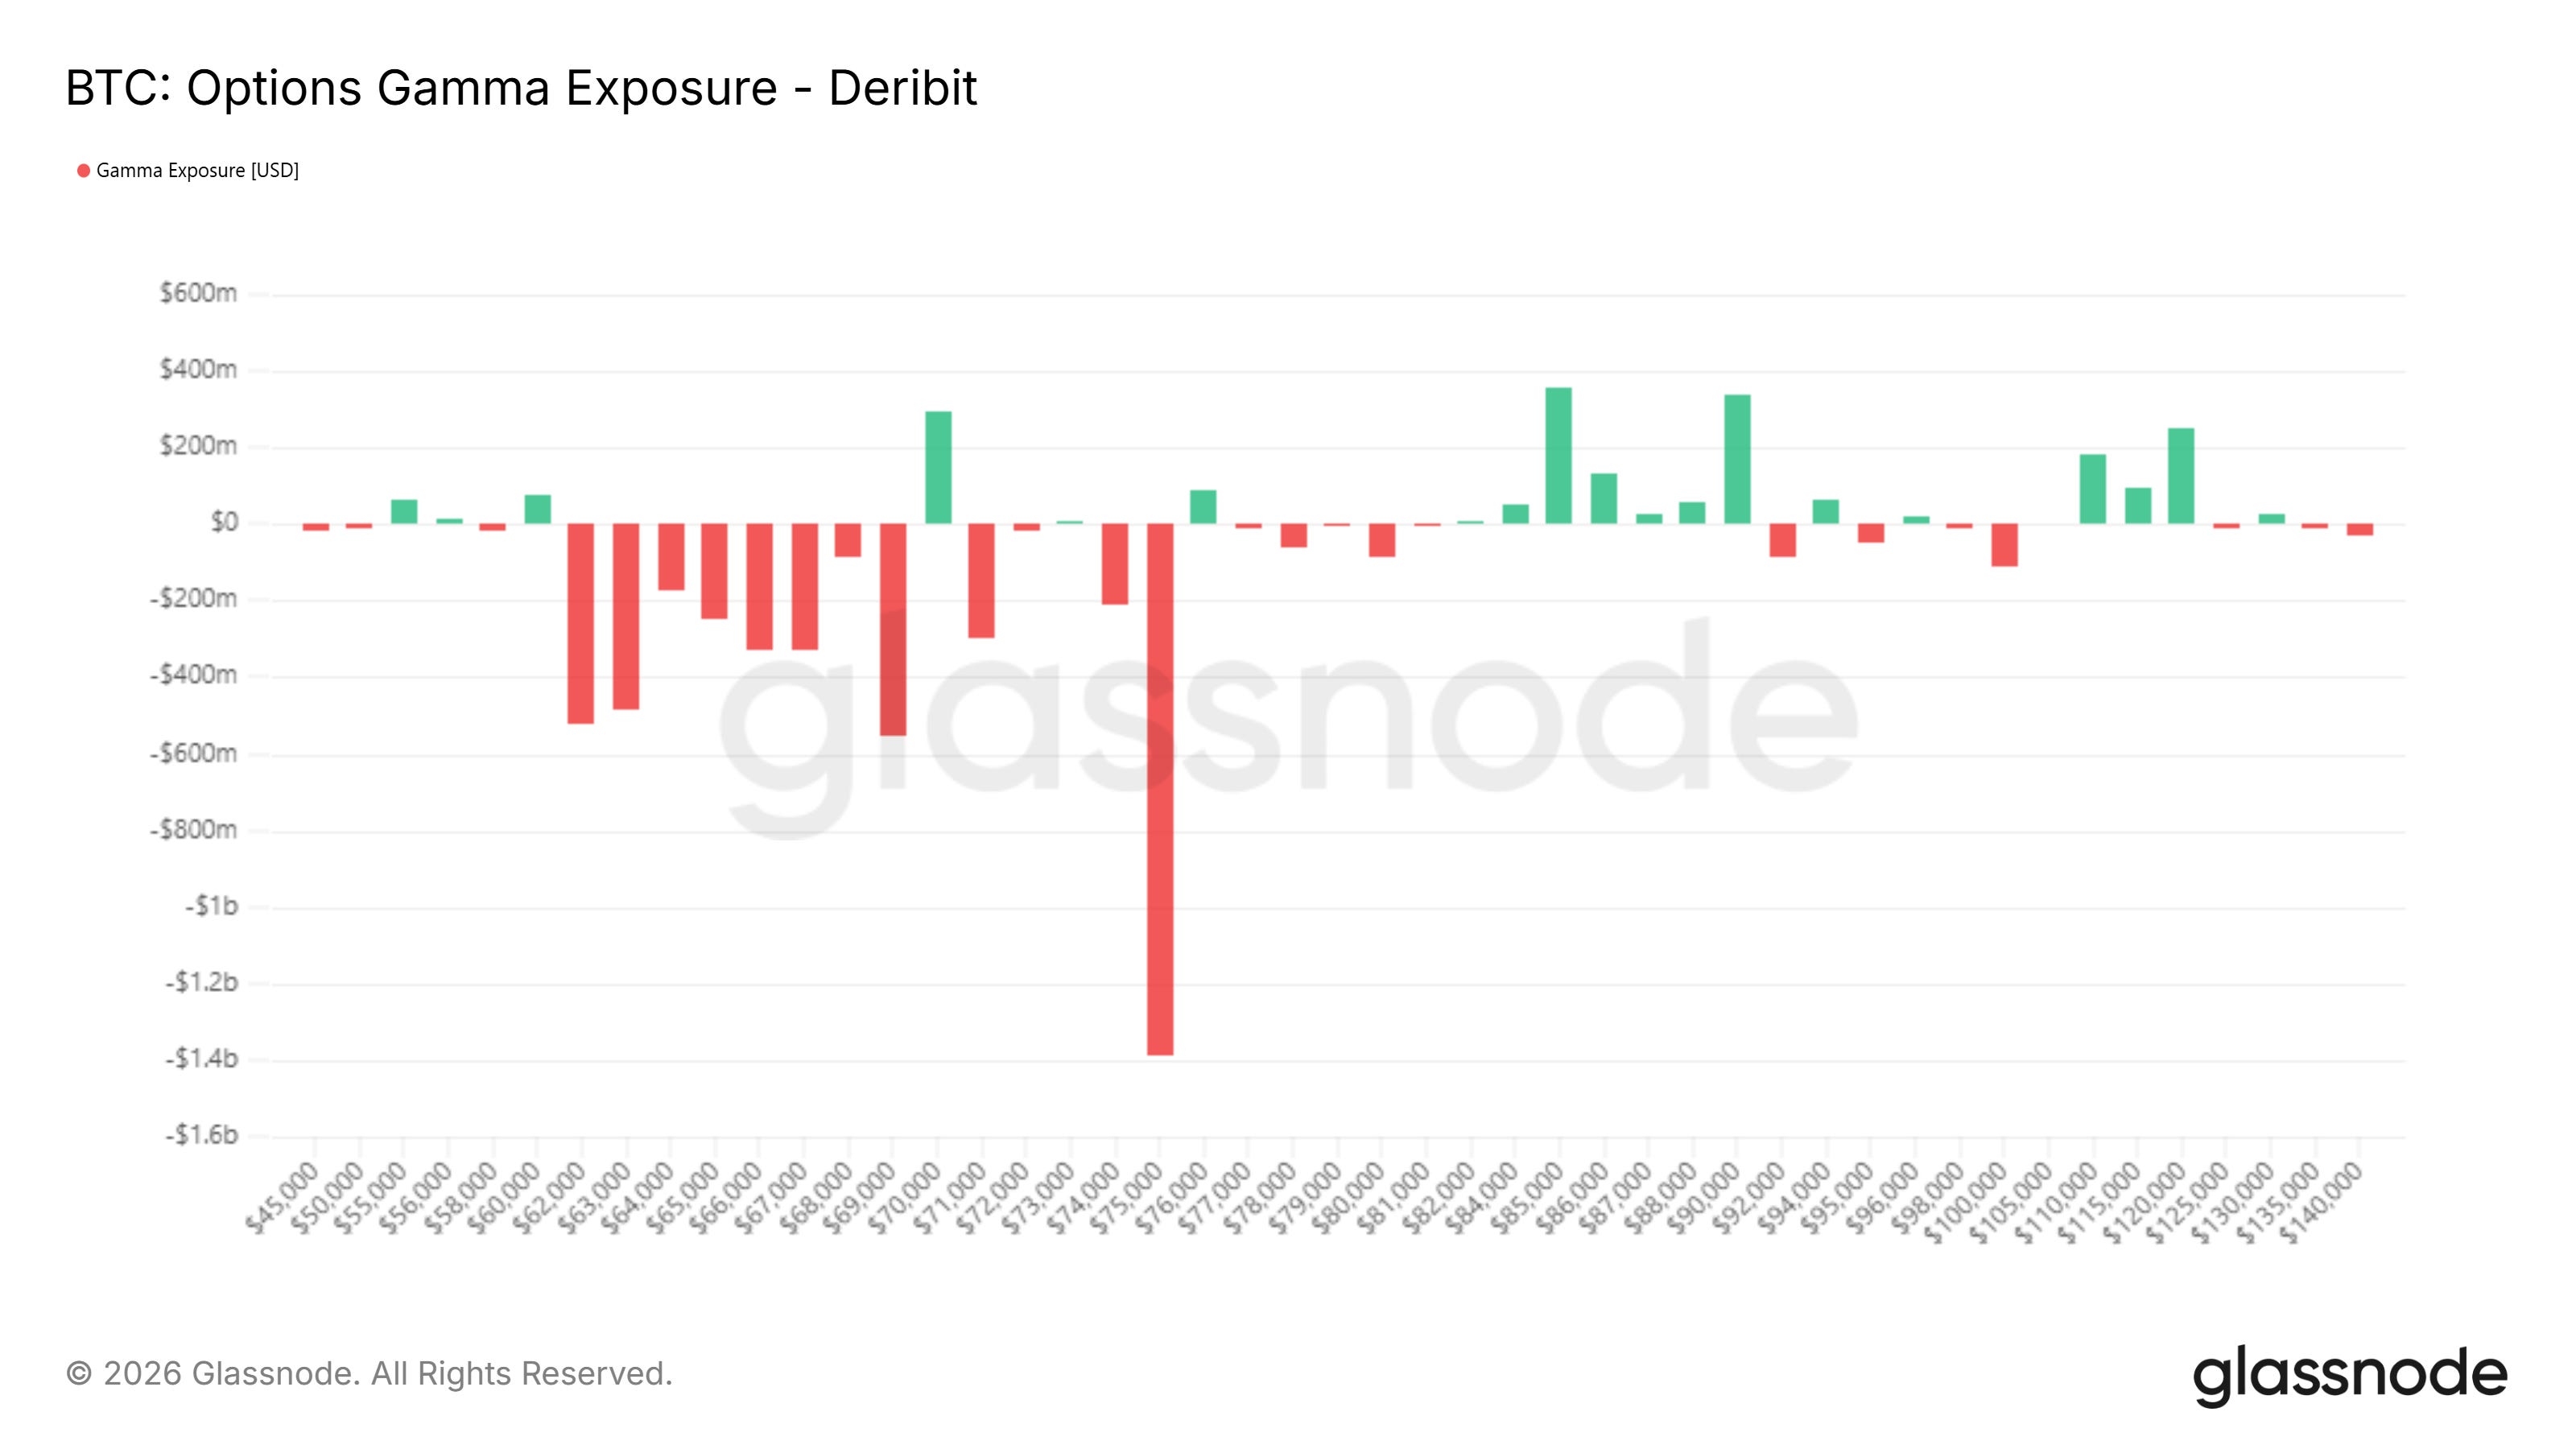
The aggregated gamma profile across all maturities reveals a clear imbalance. The dominant feature of the surface is a large negative gamma concentration centered around $75K, with additional negative clusters extending through the $69K to $74K region and into the mid-$60Ks. The $75K node stands out as structurally significant, representing the single largest pocket of negative gamma on the board.
This configuration matters. Within this mid-range band, hedging flows are inherently destabilizing. If price trades through these levels with momentum, dealer hedging is likely to amplify the move rather than absorb it. This helps explain why the recent breakdown accelerated so quickly once key support levels gave way. The structure itself was fragile.
Below the mid-$60Ks, negative gamma persists but becomes more fragmented and less concentrated. The largest convexity risk was not at the ultimate lows, but in the mid-zone where positioning had accumulated during prior consolidation.
In contrast, the gamma profile shifts meaningfully above $85K. There, exposure turns positive and builds across higher strikes, particularly into the $85K to $90K region and again beyond $100K. In those zones, hedging flows would likely become stabilizing rather than amplifying. This creates an asymmetric mechanical landscape.
Below roughly $75K, the structure is prone to acceleration. Above approximately $85K, it becomes progressively more absorptive. The current price sits between these two regimes. The practical implication is straightforward. A decisive move back into the dense negative gamma cluster around $70K to $75K would increase the probability of renewed volatility expansion. Conversely, a sustained reclaim of the positive gamma zone above $85K would reduce structural fragility and favor more orderly price action. This is not a uniformly stable environment. It is mechanically sensitive.
The stability observed this week is conditional, dependent on remaining within a narrow equilibrium band. Outside of it, the underlying gamma architecture suggests that moves can still accelerate quickly.
