
Options Market Report: Bitcoin’s Key Levels Into Late March
What are the Derivatives signalling about BTC


Over the past week, Bitcoin traded in a relatively tight range, hovering in the mid to high 60s. To understand what may come next, it helps to look at what options traders have been doing. Options markets do not predict the future with certainty, but they reveal how professional traders are positioning for different outcomes. By combining premium flow, which shows what traders actively bought or sold last week, with open interest, which shows what positions were added or removed between February 16 and February 22, we can get a grounded picture of expectations for short and mid term.
During the week, traders were net buyers of options overall, with roughly 4.3 million dollars more spent on buying options than selling them. More premium went into puts than calls. That means a meaningful portion of activity was protection rather than outright upside speculation. When the put premium exceeds call premium, it usually reflects hedging behavior rather than aggressive bullish positioning.
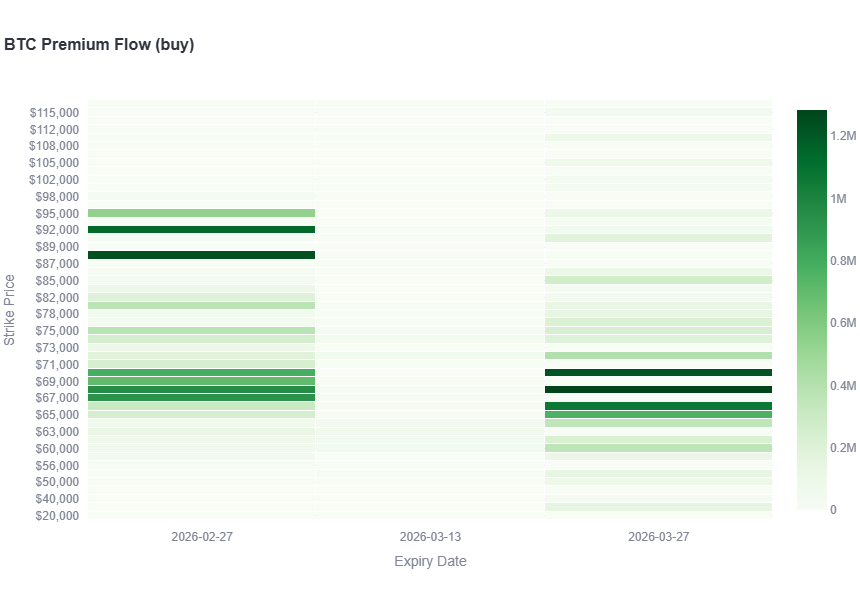
If we look at the February 27 expiry in the premium flow charts, two areas stand out. The first is the high 60,000s, which is where the spot has been trading. Heavy activity is expected there, as traders continuously hedge and adjust positions near the current price. That confirms the high 60s are an active pivot, but it does not by itself signal direction.
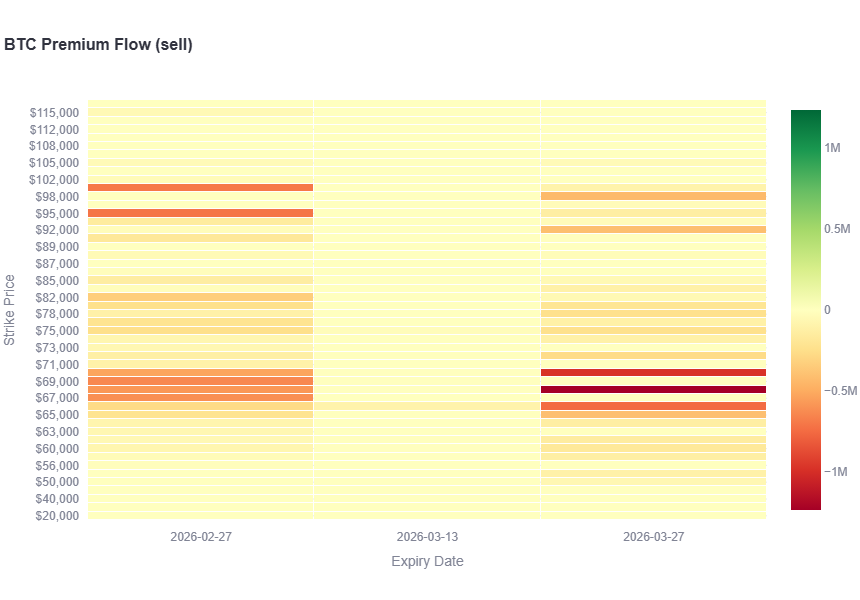
More interesting is the activity higher up the curve. The buy heatmap shows concentrated buying between roughly 88,000 and 95,000. At the same time, the sell heatmap shows strong selling between roughly 95,000 and 100,000. That creates a visible band where traders are actively engaging on both sides.
When you see buying below a zone and selling just above it, it often suggests the market sees that area as a potential upside target, followed by resistance. In this case, the 88,000 to 95,000 region looks like a plausible upside magnet, while 95,000 to 100,000 appears to be treated as a supply zone.
Now the key question is, did these trades stay on, or were they quickly closed? To answer that, we look at the change in open interest between February 16 and February 22.
