
Momentum is Cooling
A recovery signal has appeared, but the momentum is cooling

Introduction
The Bitcoin Momentum Model converts recent price action into a simple regime signal: bullish when momentum is positive, bearish when momentum is negative, and neutral when momentum is close to zero. The point is to manage risk by staying exposed during sustained uptrends and getting defensive during sustained downtrends.
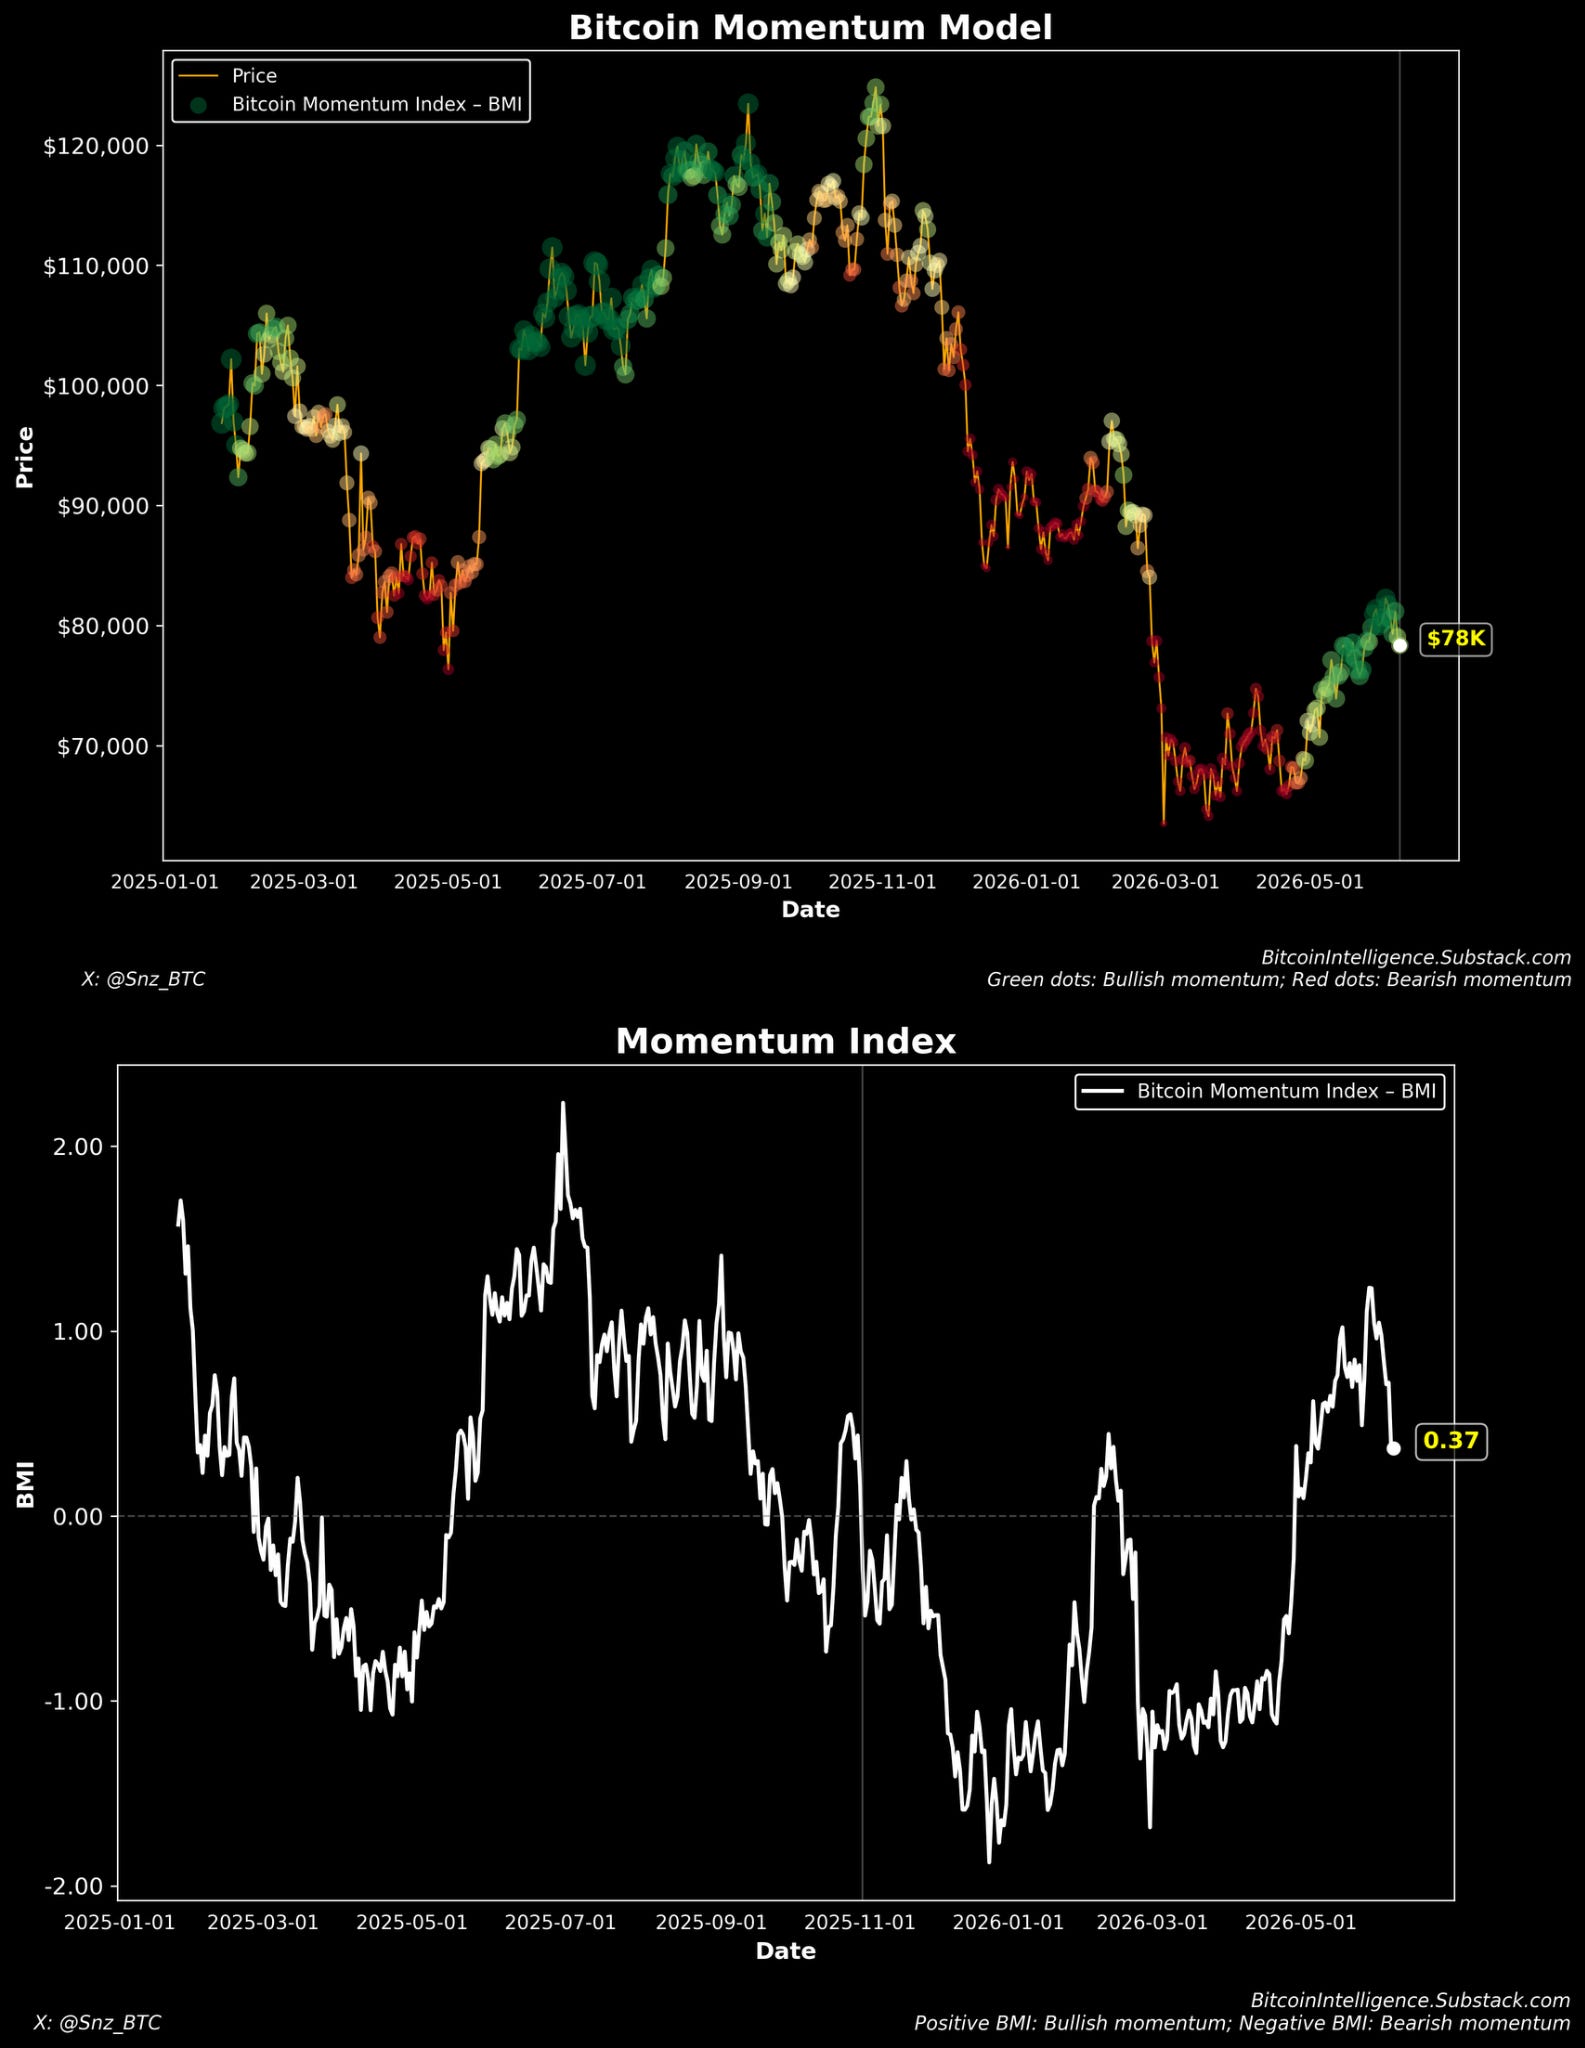
The latest update shows momentum is cooling after a clear change from the deeply bearish conditions that dominated the first quarter of 2026. Bitcoin is trading near $78K, and the Bitcoin Momentum Index (BMI) is positive at 0.37. That matters: the model is no longer flashing a strong bearish signal. But it is also not flashing a strong bullish signal. This is a cautious recovery regime, not a clean all-clear. Since momentum is cooling, we advise caution here until it recovers.
The Latest Signal: Still Positive, but Weaker
Bitcoin is near $78K, and the latest momentum dots have shifted back toward green/white rather than red. In the language of the model, that means the market has moved out of the strongest bearish zone and into a mildly bullish or transition regime.
That is an improvement from March, when the model was still deep in bear territory after the sharp drawdown. The price action since then has been constructive: Bitcoin stabilized in the high-$60K range, recovered toward the low-$80K area, and has held above the worst levels of the selloff. Still, the recovery is not yet broad enough to call this a strong bullish regime.
The most important detail is that the model is positive, but only modestly positive. A BMI reading of 0.37 is above the zero line, but it is not high enough to justify complacency. A small deterioration in price action could push the model back toward neutral or bearish territory.
Zooming In: Light Green
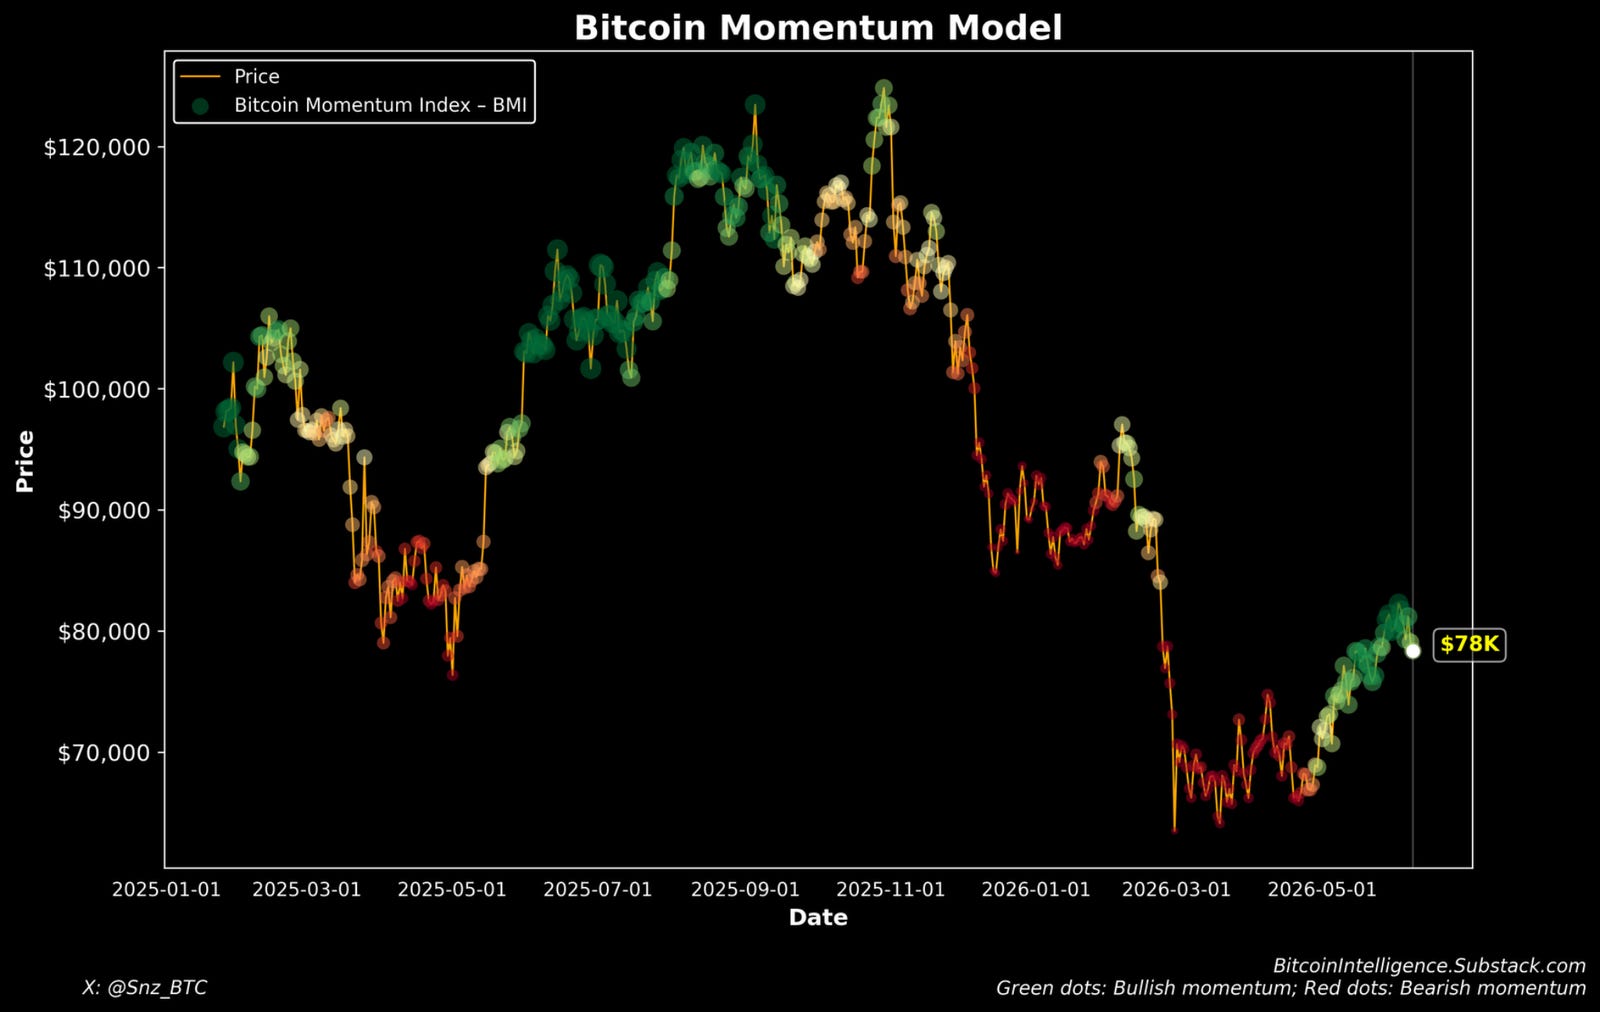
The one-year chart shows the regime shift more clearly. Bitcoin peaked above $120K in late 2025, then entered a long and painful downtrend that pushed price into the mid-to-high $60K range by early 2026. During that decline, the dots turned red and orange, correctly warning that momentum had broken down.
The recent recovery was real. Since late April and May, the chart shows more green dots, higher prices, and a visible break from the worst phase of the decline. But the current setup still has two weaknesses. First, price remains far below the prior peak. Second, the latest price action is choppy rather than impulsive. Momentum has improved, but it has not yet rebuilt the kind of persistent strength we want to see in a durable bull phase. You can see in the chart that the color is changing from dark green to light green.
This is exactly where investors tend to make mistakes. After a sharp rebound, it is tempting to assume the bear phase is over. The model is saying something more precise: the bearish pressure has weakened, but the recovery still needs confirmation.
The BMI Reading: Mildly Bullish
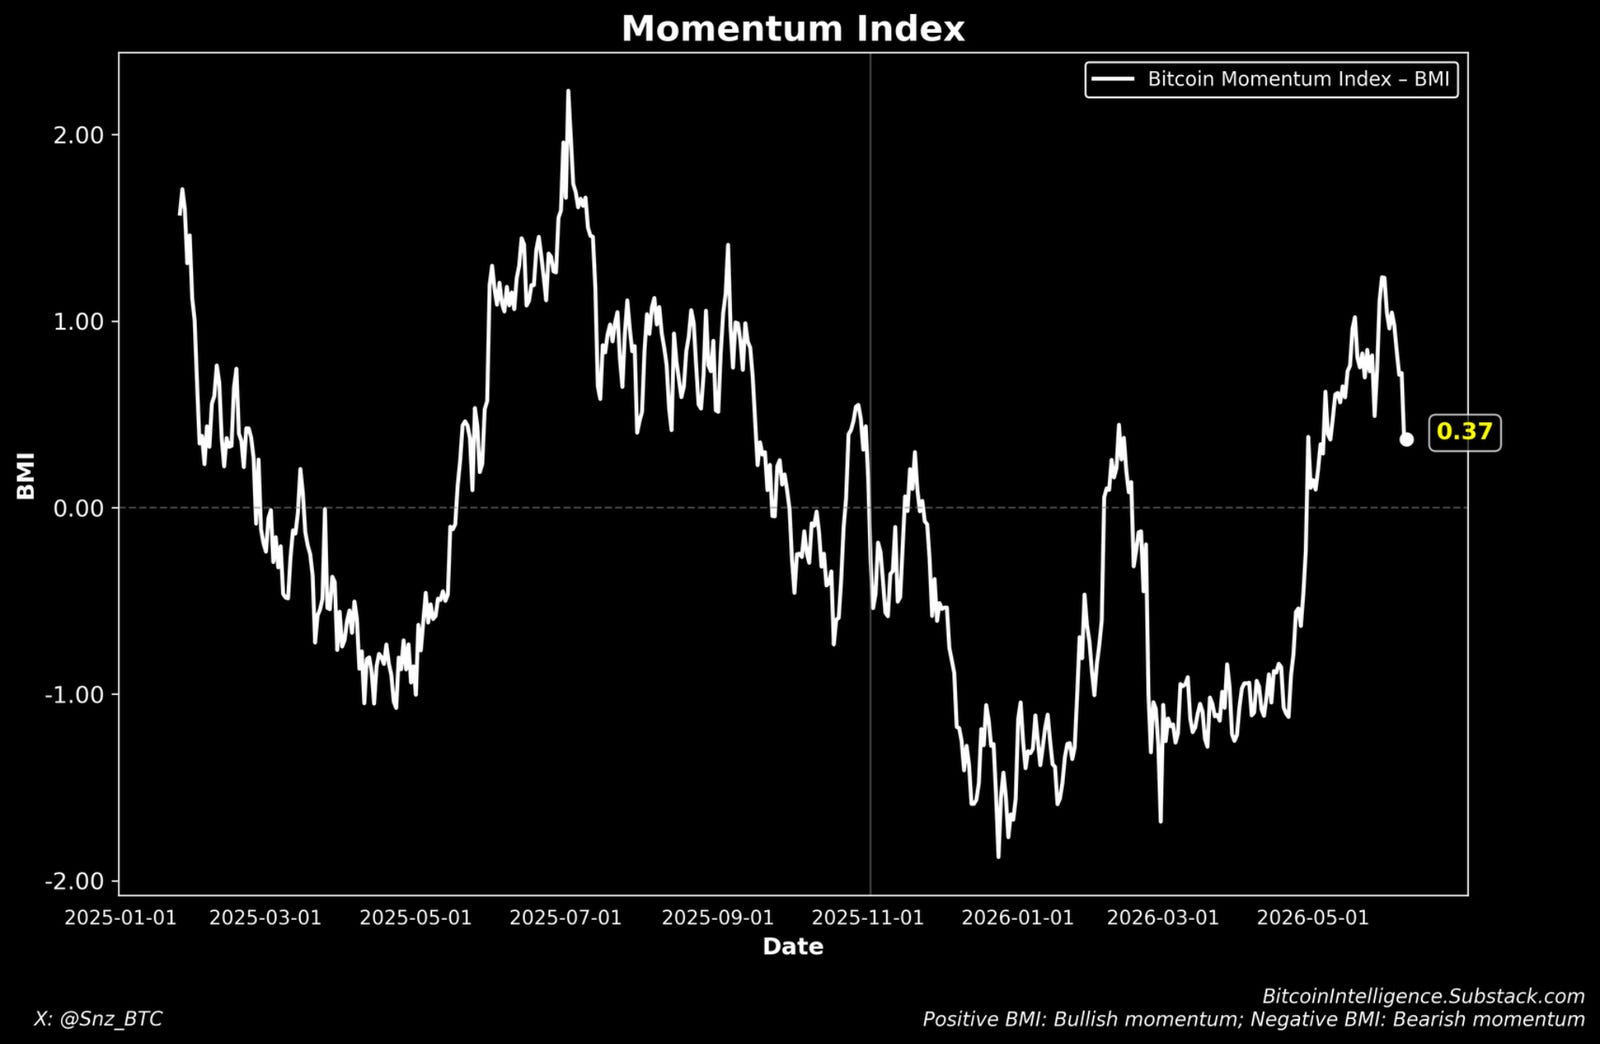
The current BMI reading is 0.37. That is the key number in this update.
The BMI fell sharply during the late-2025 and early-2026 selloff, reaching deeply negative territory near the start of the year. It then recovered strongly into May, briefly rising above 1.0 before pulling back to the current 0.37 reading. In plain English, momentum has recovered, but it has also cooled from its recent high.
Note the pullback. A rising positive BMI would give a cleaner risk-on message. A falling but still positive BMI gives a more cautious message: the market has improved enough to stop treating Bitcoin as a clear bear-regime asset, but not enough to aggressively chase risk. The next few weeks are important. If BMI holds above zero and turns higher again, the bullish case strengthens. If BMI breaks back below zero, this rebound could turn into another fakeout.
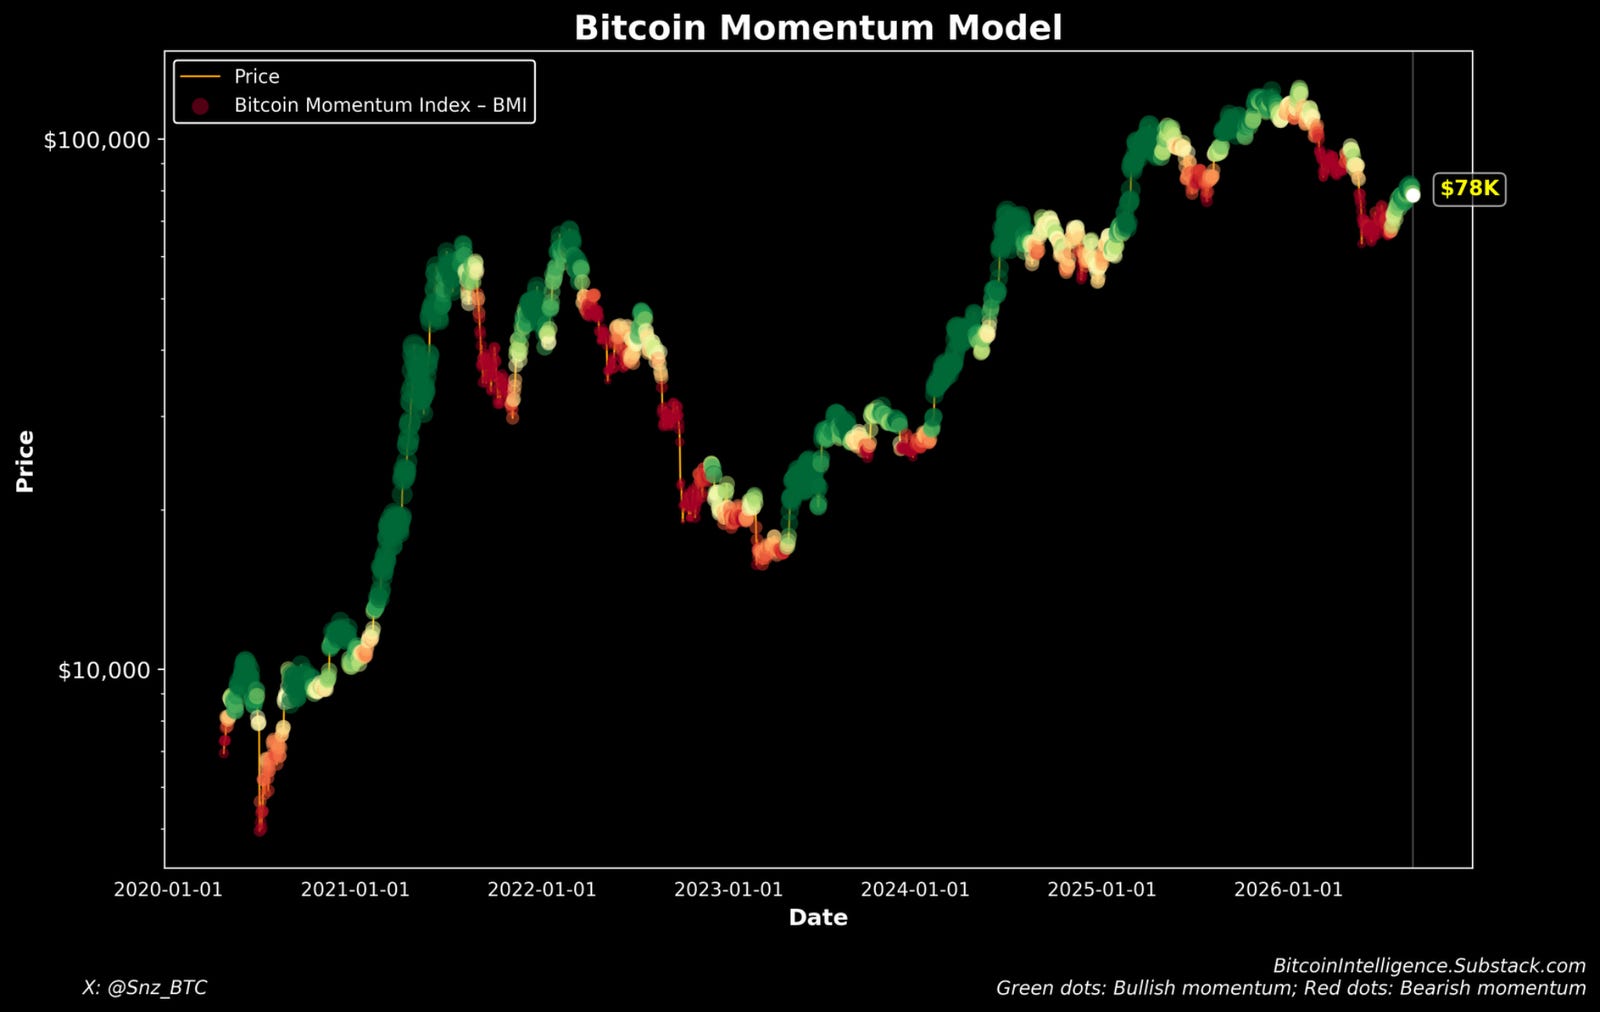
What the Bear-Signal Chart Says
