
Mapping the $80k Pivot
Actionable options intel for a high-convexity Bitcoin world.


Executive Summary
This past week was defined by a sharp and fast repricing lower that carried many of the hallmarks of capitulation rather than a slow distribution. After spending most of January grinding toward the $91,000 level, Bitcoin reversed aggressively, falling nearly twenty percent in a compressed window and slumping into the mid-$70,000s by Sunday night. The speed of the move mattered as much as the magnitude. This was not a market patiently rotating risk, but one forcefully shedding leverage, amid over $1.1 billion in ETF outflows, flushing weak positioning and resetting expectations in a matter of days.
From an options perspective, the selloff immediately altered the market’s internal map. Short-dated volatility expanded, with the DVOL index jumping from 37 to over 44 as spot moved decisively through previously well-defended strikes. The January 30th expiry served as the clearing event: the vast majority of upside calls expired worthless, while a large share of downside puts moved into-the-money, the balance of positioning shifted from expressing upside continuation to actively defining downside risk. What stood out, however, was not panic, but structure. Rather than an indiscriminate rush to buy deep tail protection, the options market responded by rapidly re-centering premium around the $80,000–$85,000 range, drawing clearer boundaries around where risk was considered tolerable versus destabilizing.
As the week closes, the options market is no longer pricing the same world it was seven days earlier. The “fair value” implied by premium flows has moved lower, aligning closely with current spot, while downside risk is being explicitly defined rather than left open-ended. At the same time, longer-dated positioning, notably the continued activity in March $105,000 calls, suggests that participants are not abandoning the broader bullish regime, but are instead recalibrating time and path. In other words, this looks less like a structural breakdown and more like a violent, necessary reset in positioning.
The key takeaway is that the crash did not leave the options market disoriented; it produced a more legible landscape. Near-term strikes have become more influential, volatility has made price levels matter again, and the market has started to communicate, through where it is willing to pay premium, what it sees as the acceptable floor for the coming weeks. The rest of this note will focus on what those levels are and what they imply for both recovery scenarios and the remaining downside risk.
The Levels the Options Market Is Defending
The plunge to ~$74,000 marked the first true stress test of the post-reset market structure. While the move was violent, the speed of the recovery back toward the $78,000 area suggests that the market identified a zone of high-conviction support rather than triggering a broader breakdown. This behavior is more consistent with a forced liquidation event than a loss of structural demand.
Importantly, the rebound was not purely technical. As spot pushed to its local lows, our internal risk appetite measures began to diverge, stabilizing and turning higher even as price continued to slide. This divergence points to a shift in behavior among more sophisticated participants: rather than chasing downside, volatility expansion was used as an opportunity to sell elevated premium and re-anchor positioning. In that sense, the $74,000 print functioned as a liquidation floor, flushing the remaining over-leveraged longs and clearing the path for stabilization.
The $80k Magnet & Near-Term Resistance
Following that reset, options positioning has coalesced around three critical price zones:
The $80,000 Put Wall
This remains the primary defensive line. Despite the brief excursion below, the highest concentration of downside open interest and net premium remains centered at $80,000. Positioning here creates a natural gravitational pull, as hedging flows tend to dampen moves away from the strike and favor consolidation while premium decays.
The $88,000–$90,000 Ceiling
Any immediate recovery is likely to encounter resistance in this band. The aftermath of the January 30th expiry, where the vast majority of upside calls expired worthless, has given way to a more conservative layer of call supply. Current positioning suggests dealers are likely short gamma in this region, meaning rallies into this zone could be met with selling pressure as hedges are adjusted, slowing upside momentum.
The March $105,000 Beacon
Notably, longer-dated optimism has not disappeared. Open interest at the $105,000 strike for the March expiry has remained resilient, signaling that while the near-term path is being recalibrated around $78,000–$82,000, end-of-quarter expectations among institutional participants appear largely intact.
The current consolidation near $78,000 reflects a market in pause mode. With volatility skew having reached extreme downside levels during the selloff, the cost of protection is beginning to normalize, and pricing is becoming more symmetric. Bitcoin is no longer being valued through the momentum lens of January, but through the defensive structures now in place.
If the market can reclaim and hold the $80,000 handle, the capitulation phase will give way to a re-accumulation regime. Failure to do so would reopen the discussion around downside acceleration, but for now, the options market is clearly signaling where it believes the battle lines are drawn.
Volatility Analysis: Pricing Fear vs. Reality
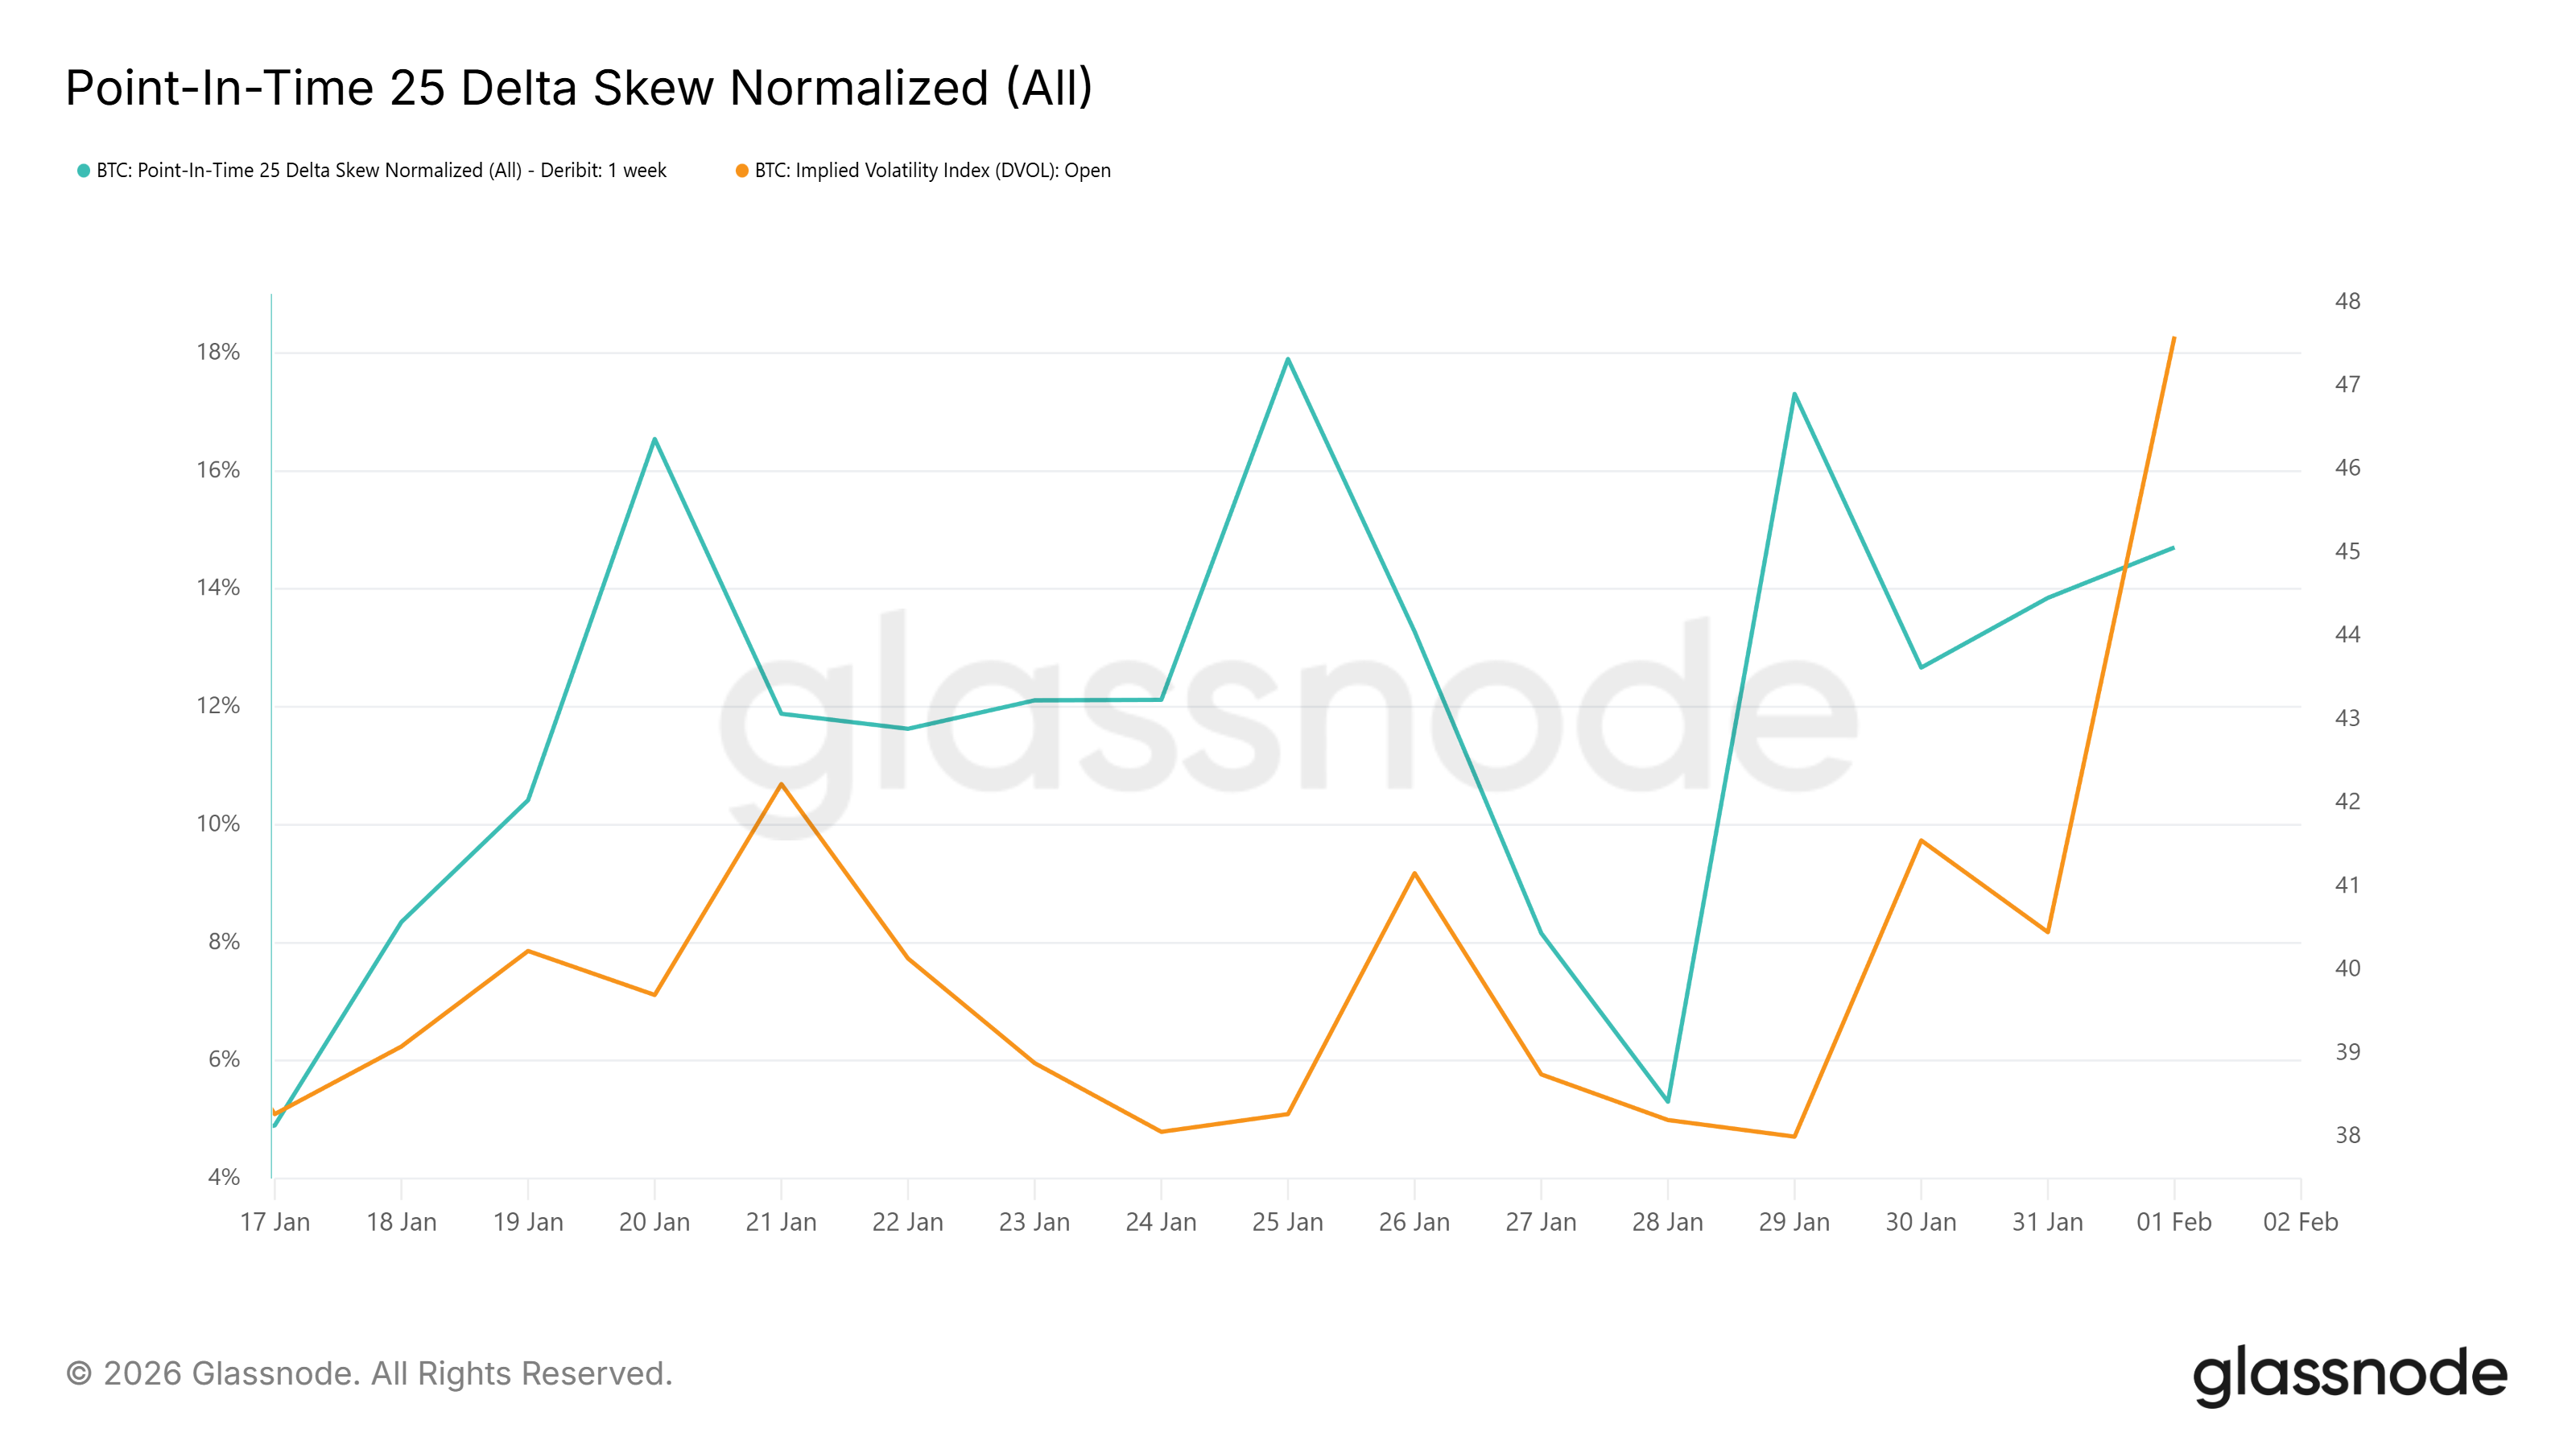
If the spot move was about flushing leverage, the volatility expansion was about re-pricing risk. The defining feature of the past week was the vertical surge in implied volatility: the DVOL Index jumped from the high-30s to above 44, briefly peaking near the upper-40s as spot collapsed. This was not a slow grind higher in volatility, but a rapid repricing event that reflected stress rather than uncertainty.
Importantly, the volatility spike was not driven by crypto-specific dynamics alone. It occurred alongside broader macro pressure, including renewed stress in global rates markets and fresh geopolitical trade concerns, creating a risk-off overlay that amplified downside hedging demand.
The Skew Collapse
The clearest expression of fear appeared in the 25-delta volatility skew. At the height of the selloff, normalized 25-delta skew surged to extreme levels, reflecting an outsized premium for downside protection. In practical terms, the market was paying an outsized “crash tax” for protection as the $80,000 level failed and spot accelerated lower.
Historically, skew at these levels tends to be self-limiting. When downside insurance becomes this expensive, marginal demand for protection is often exhausted. Rather than forecasting further acceleration, extreme skew frequently marks the point at which fear is fully priced.
Risk Appetite Divergence
While headline volatility screamed panic, a more subtle signal emerged beneath the surface. Despite a sharp, double-digit drawdown in spot, Risk Appetite Index appeared to drift higher. This divergence suggests that more sophisticated participants were not capitulating alongside price, but selectively engaging with the volatility spike.
In effect, elevated implied volatility appears to have attracted supply. Expensive downside premium created opportunities for volatility sellers to re-enter, treating the move less as a regime shift and more as a transient dislocation driven by forced positioning.
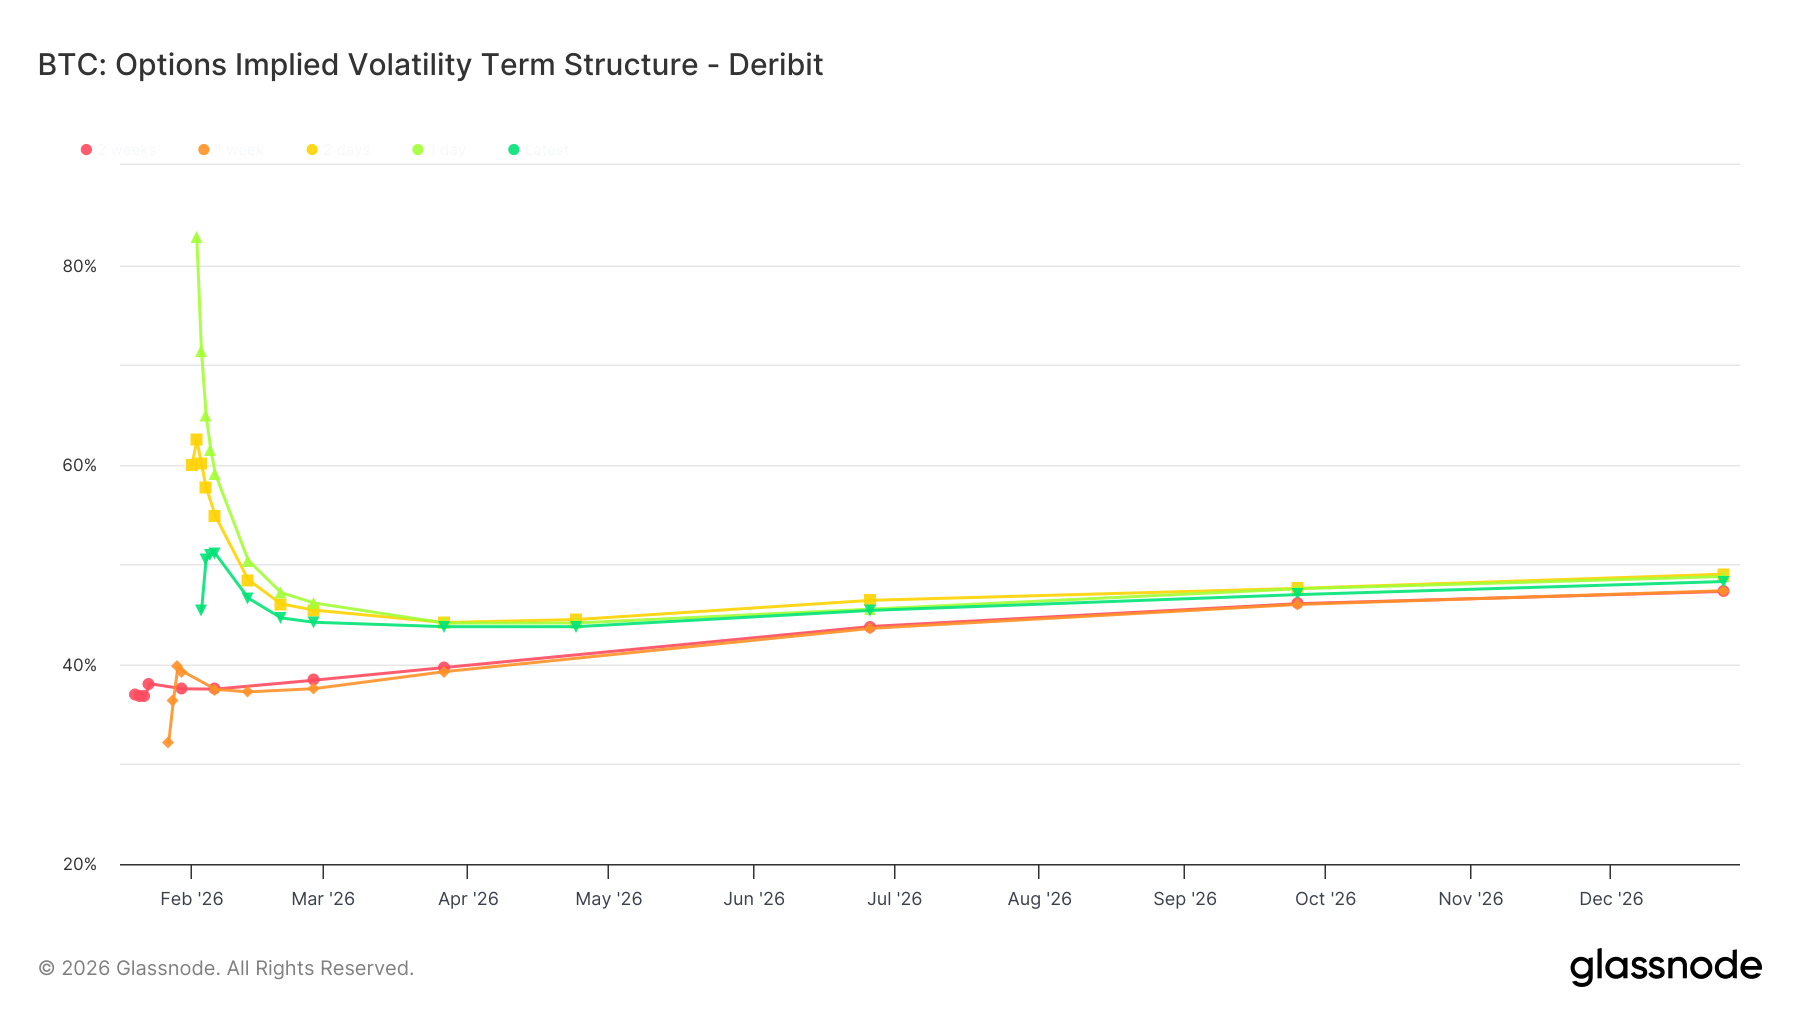
Term Structure & the “March Hope”
The shape of the volatility term structure reinforces this interpretation. While front-end implied volatility expanded violently, longer-dated tenors remained comparatively stable. This steepening of the curve indicates that the market views the recent turmoil as a near-term liquidation event rather than a structural repricing of long-term risk.
Verdict for Volatility Sellers
The easy regime of selling volatility against a stable $90,000 range is over. The market has transitioned into a higher-convexity environment where price levels and positioning matter again. While skew is likely to normalize gradually as spot stabilizes near $78,000, volatility is unlikely to collapse outright.
Residual positioning from the late-January expiry, combined with heightened sensitivity around the $80,000 pivot, suggests implied volatility will remain sticky until the market can convincingly reclaim that level. Fear may be overpriced, but uncertainty is no longer cheap.
What Comes Next
