
Local Volatility, Global Indifference
How the Options Market Absorbed the Rally Without Repricing Risk.


Summary
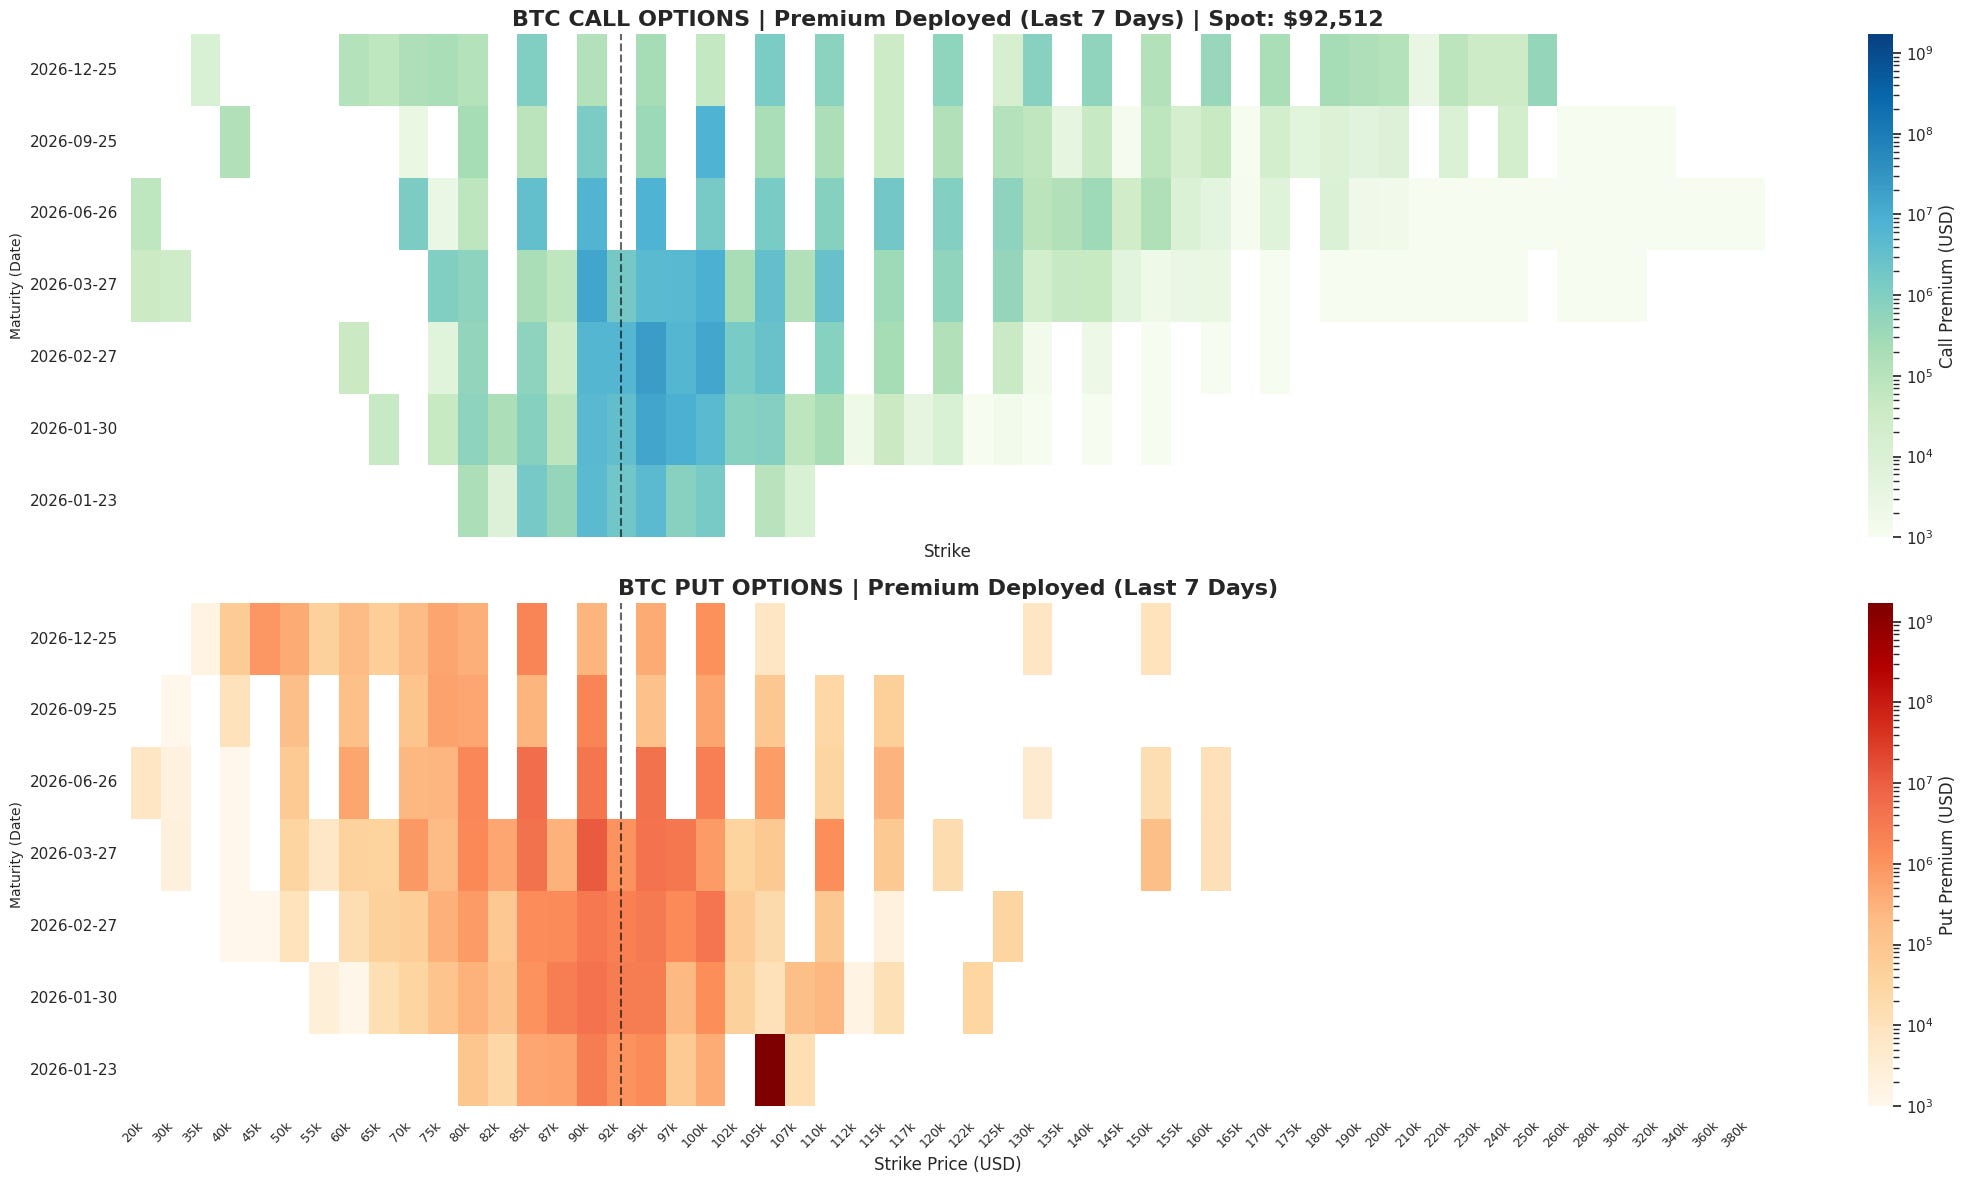
Bitcoin’s advance toward the high 90s and the subsequent pullback did not produce a durable repricing of market uncertainty. Premium was deployed primarily near spot strikes, suggesting active engagement with convexity during the move, but that demand did not extend meaningfully up the strike ladder.
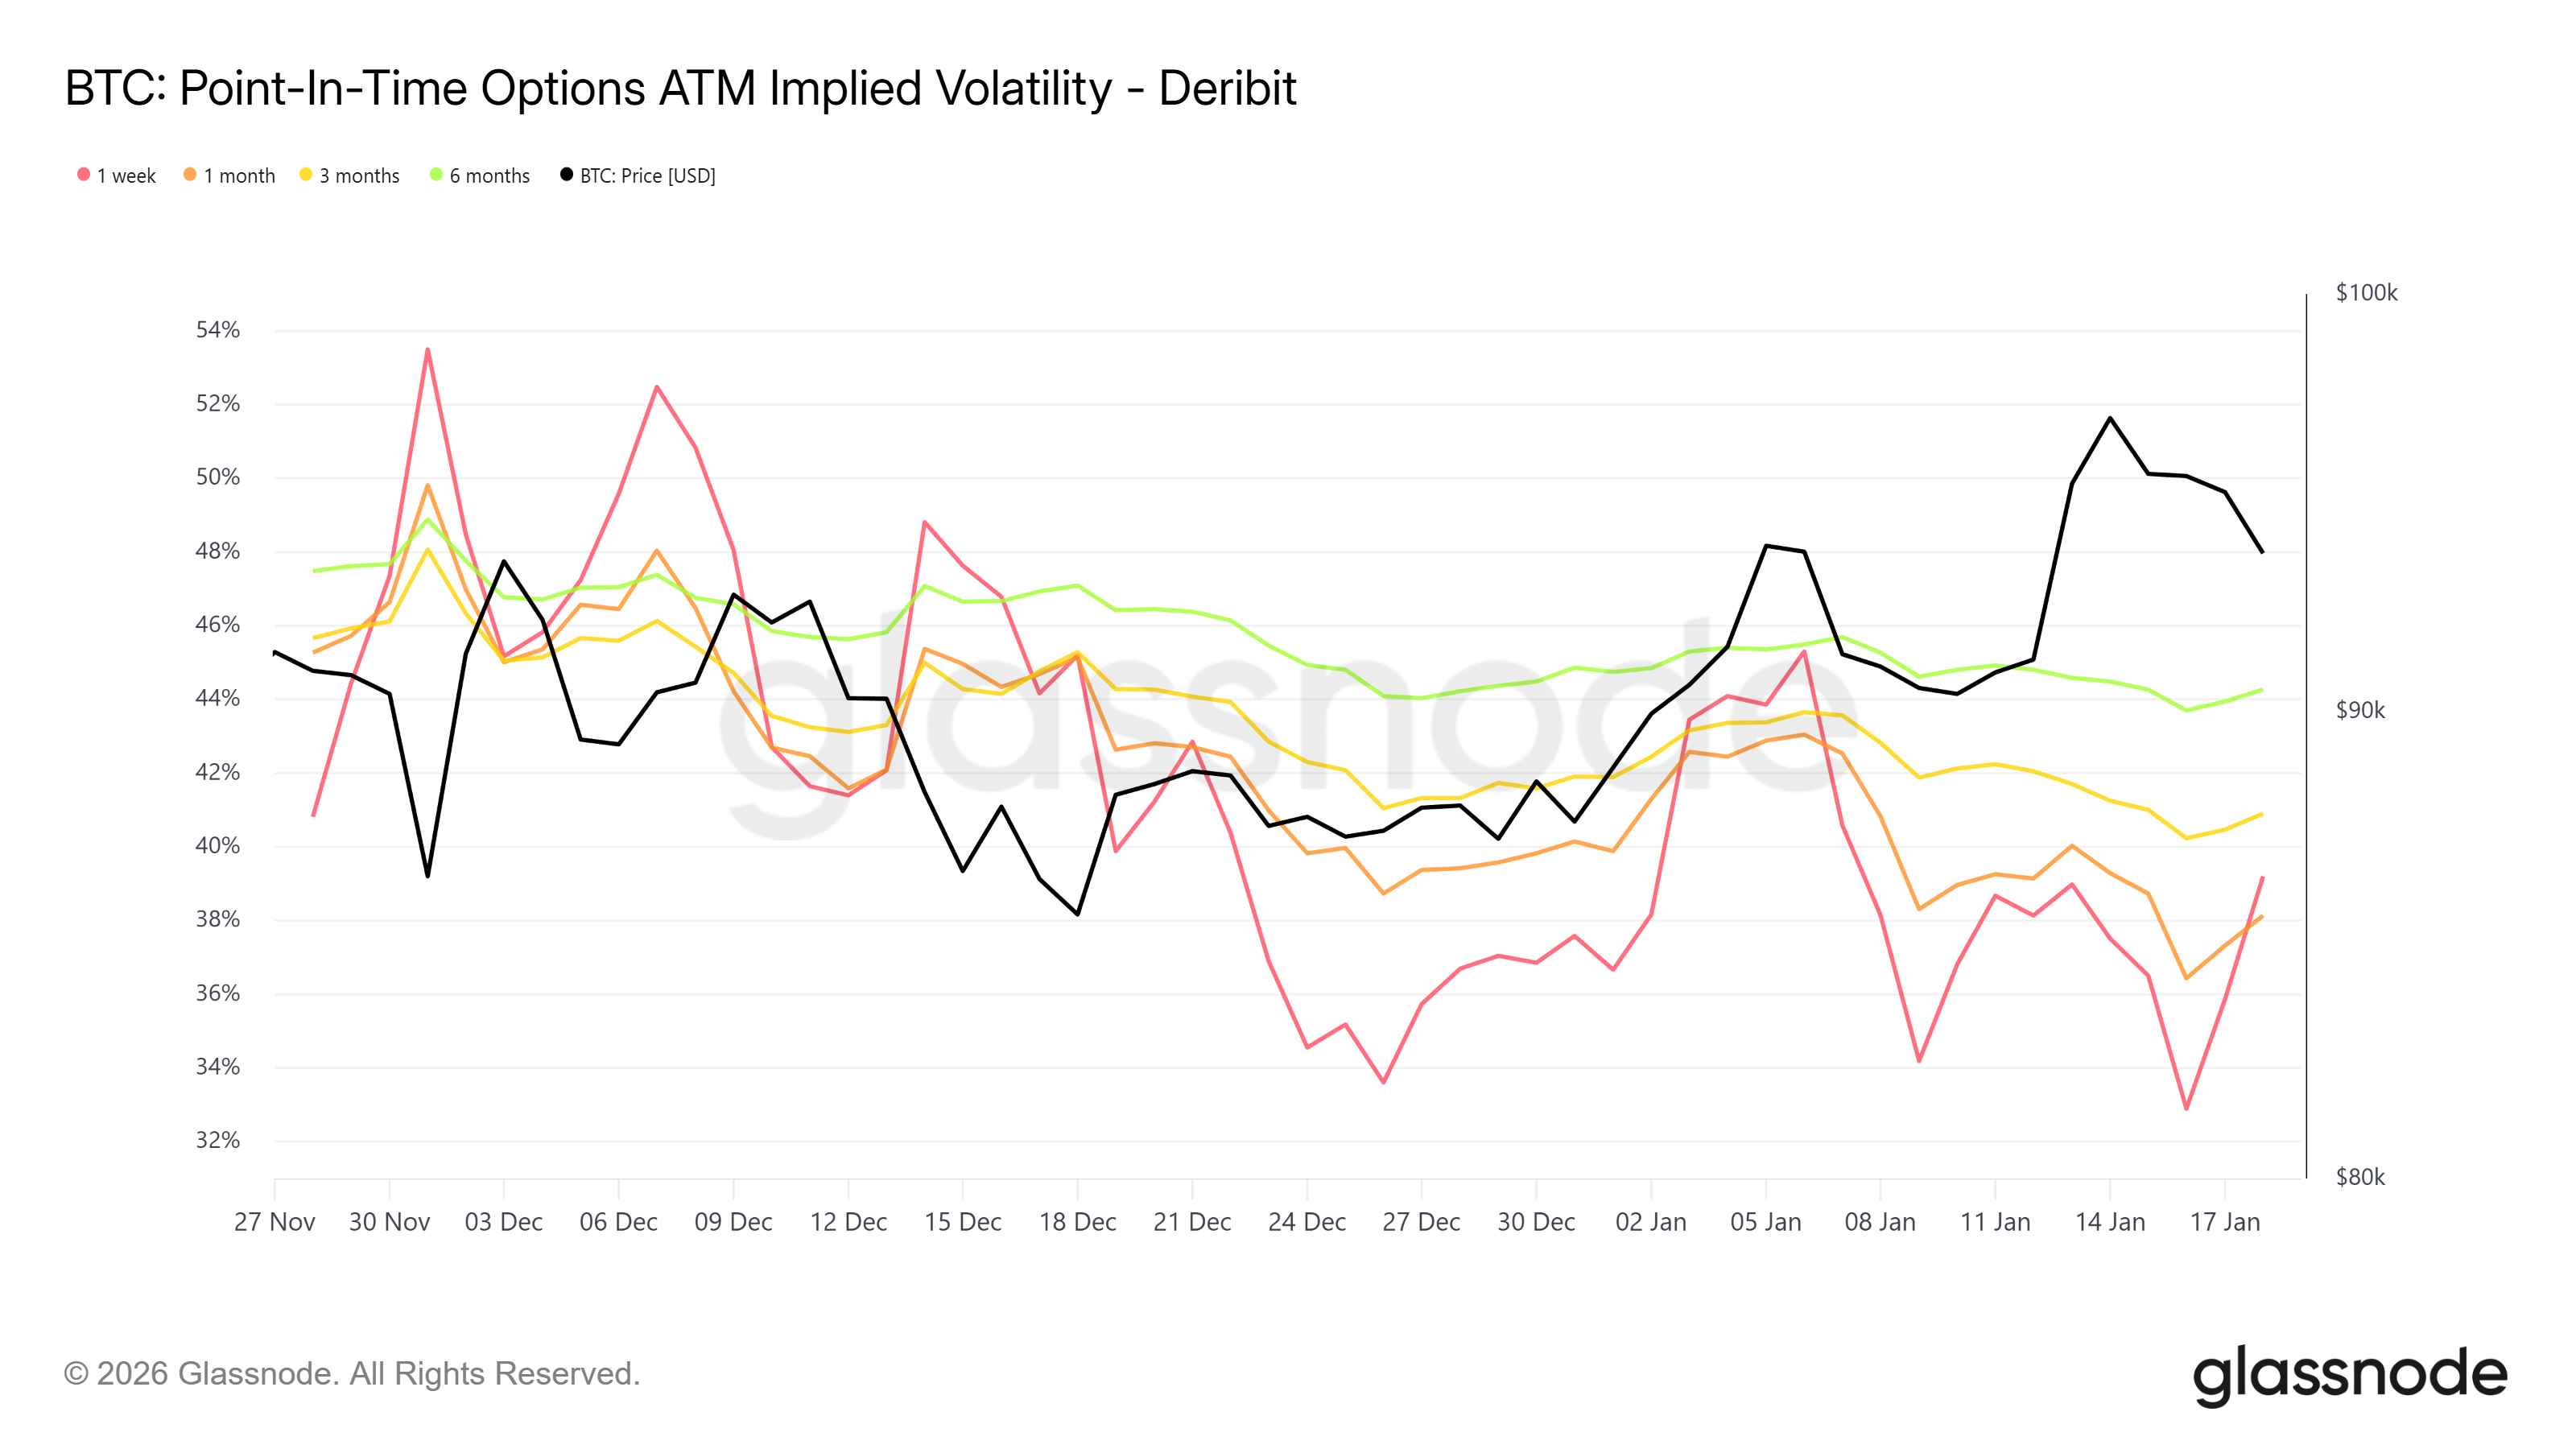
On the downside, protection remained continuously bid, distributed below spot without the clustering that typically accompanies stress. Point in time implied volatility confirms the same regime, where short-dated volatility lifted into the advance and then compressed quickly as momentum stalled. Further out on the curve, the response remained restrained, indicating that the market did not pull risk forward or price a regime transition.
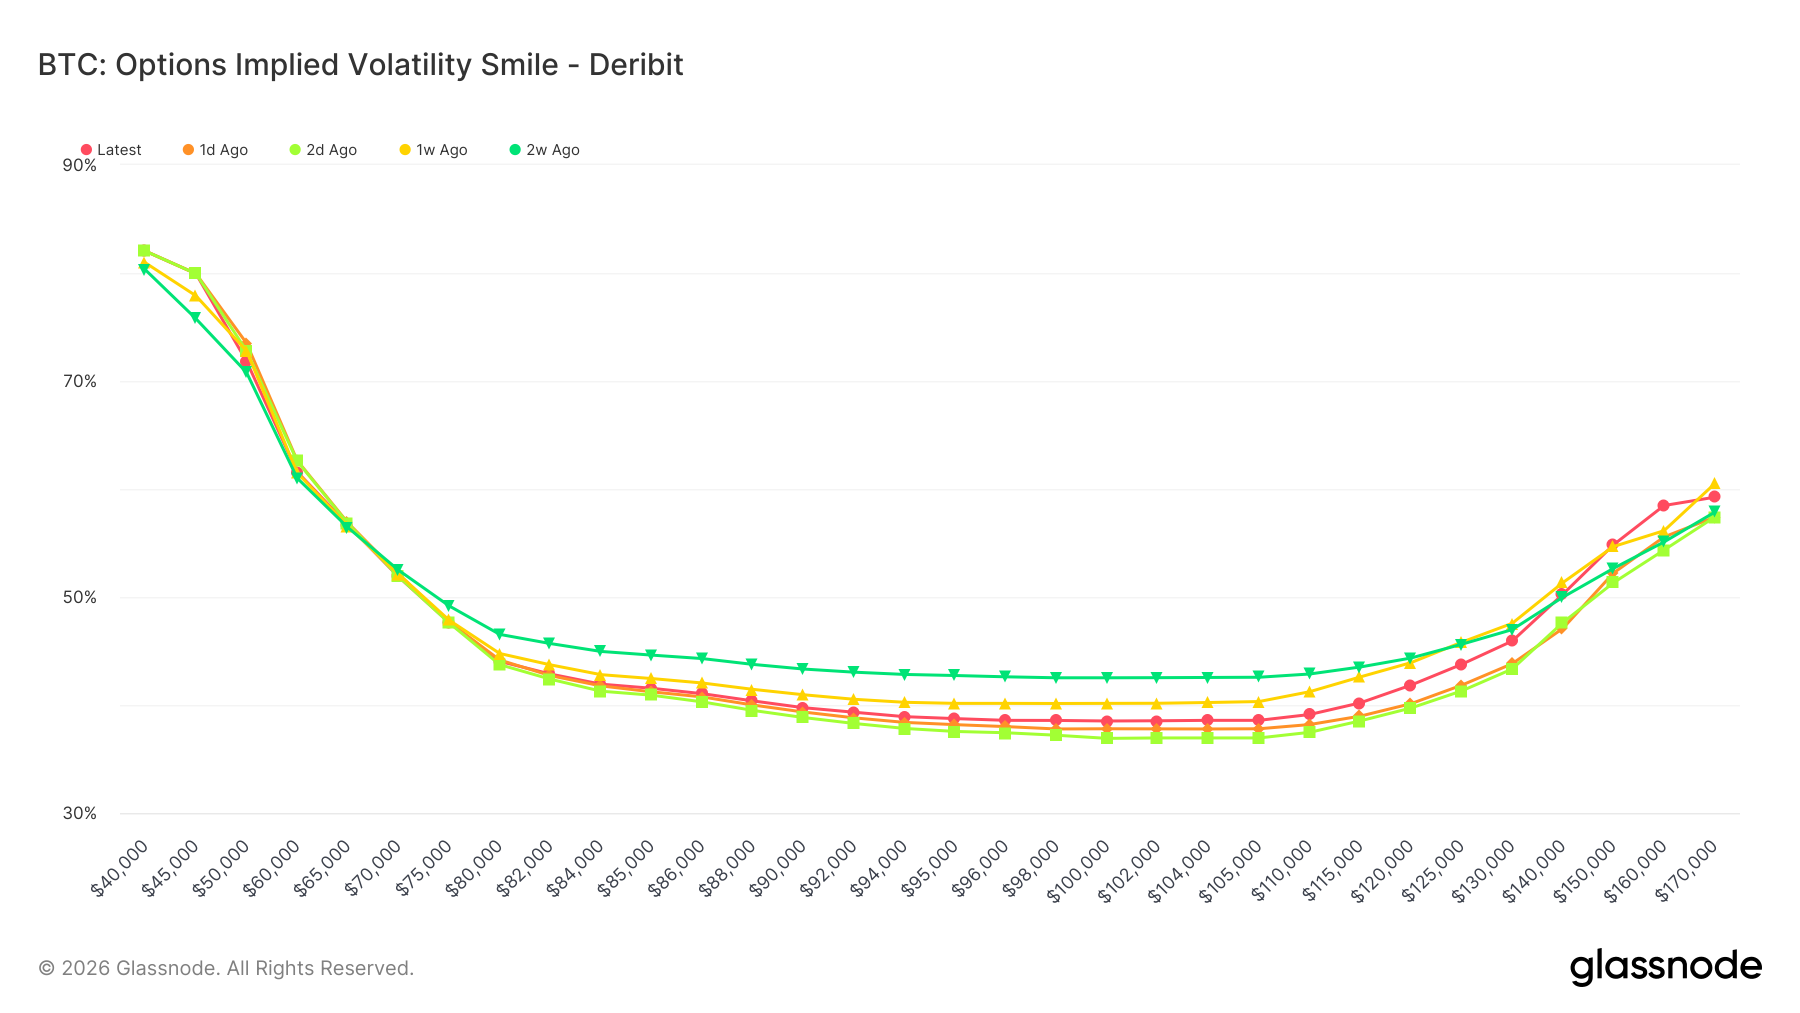
The smile for the February expiry reinforces this interpretation, where downside skew remains embedded while the upside wing rises only gradually. This implies that optionality is being carried tactically rather than chased, with participants preferring localized insurance over structural shifts.
Tactical Engagement
The chart above aggregates options premium deployed over the past seven days across all strikes and maturities, isolating market behaviour during Bitcoin’s advance toward the high 90s and its subsequent pullback. Rather than reflecting accumulated positioning, this window captures how participants responded to the move as it unfolded and how risk was repriced once momentum stalled. Call premium remains concentrated near spot across near and intermediate expiries, indicating that upside convexity continued to attract demand during the rally phase. However, this activity did not propagate meaningfully higher along the strike ladder. Premium thinness quickly becomes evident beyond the immediate spot region, suggesting that upside engagement was tactical rather than structural; participants paid for convexity close to the money but did not commit aggressively to tail outcomes.
On the downside, put premium shows broader and more persistent engagement. Downside convexity was actively priced both during the advance and following the rejection, with premium distributed below spot across multiple expiries. This pattern is consistent with protection being layered rather than a capitulation hedging event, as the absence of extreme clustering or vertical escalation implies that downside risk was managed incrementally rather than urgently. Taken together, the premium distribution reflects a market that reacted to price rather than anticipated it. Upside participation appeared conditional and short lived, while downside insurance remained consistently bid. Risk was transferred during the move, but conviction did not extend beyond the prevailing spot range, suggesting the options market responded to the rally but did not validate it.
The Velocity of the Crush
Volatility responded to the rally as Bitcoin tested the high 90s, but the reaction proved shallow and short-lived. While near-dated implied volatility adjusted quickly to extend higher, this repricing was tactical rather than structural—a distinction observed through point in time implied volatility, which preserves the specific sequencing of market reaction rather than smoothing it into averages. The spike in near-dated vol reflected an immediate demand for convexity as price accelerated toward the 100k psychological barrier, yet that response dissipated almost immediately upon the rally stalling.
The velocity of the subsequent volatility crush is the primary signal for this period. One-week implied volatility compressed rapidly following the failure to break 100k, indicating that near-term uncertainty was priced as a reaction to realized movement rather than an anticipation of a sustained trend. This rapid normalization suggests that sellers remained aggressive throughout the advance, effectively betting against a structural breakout by selling into the IV spikes.
Further out the curve, the response was notably restrained. Three-month implied volatility rose only modestly during the rally and failed to track spot in any sustained manner, showing that the market did not reassess the medium-term distribution of outcomes. This divergence between short-dated and longer-dated volatility confirms that the rally was treated as an isolated episode; participants paid for immediate flexibility while refusing to assign durability to the move.
The Institutional Anchor
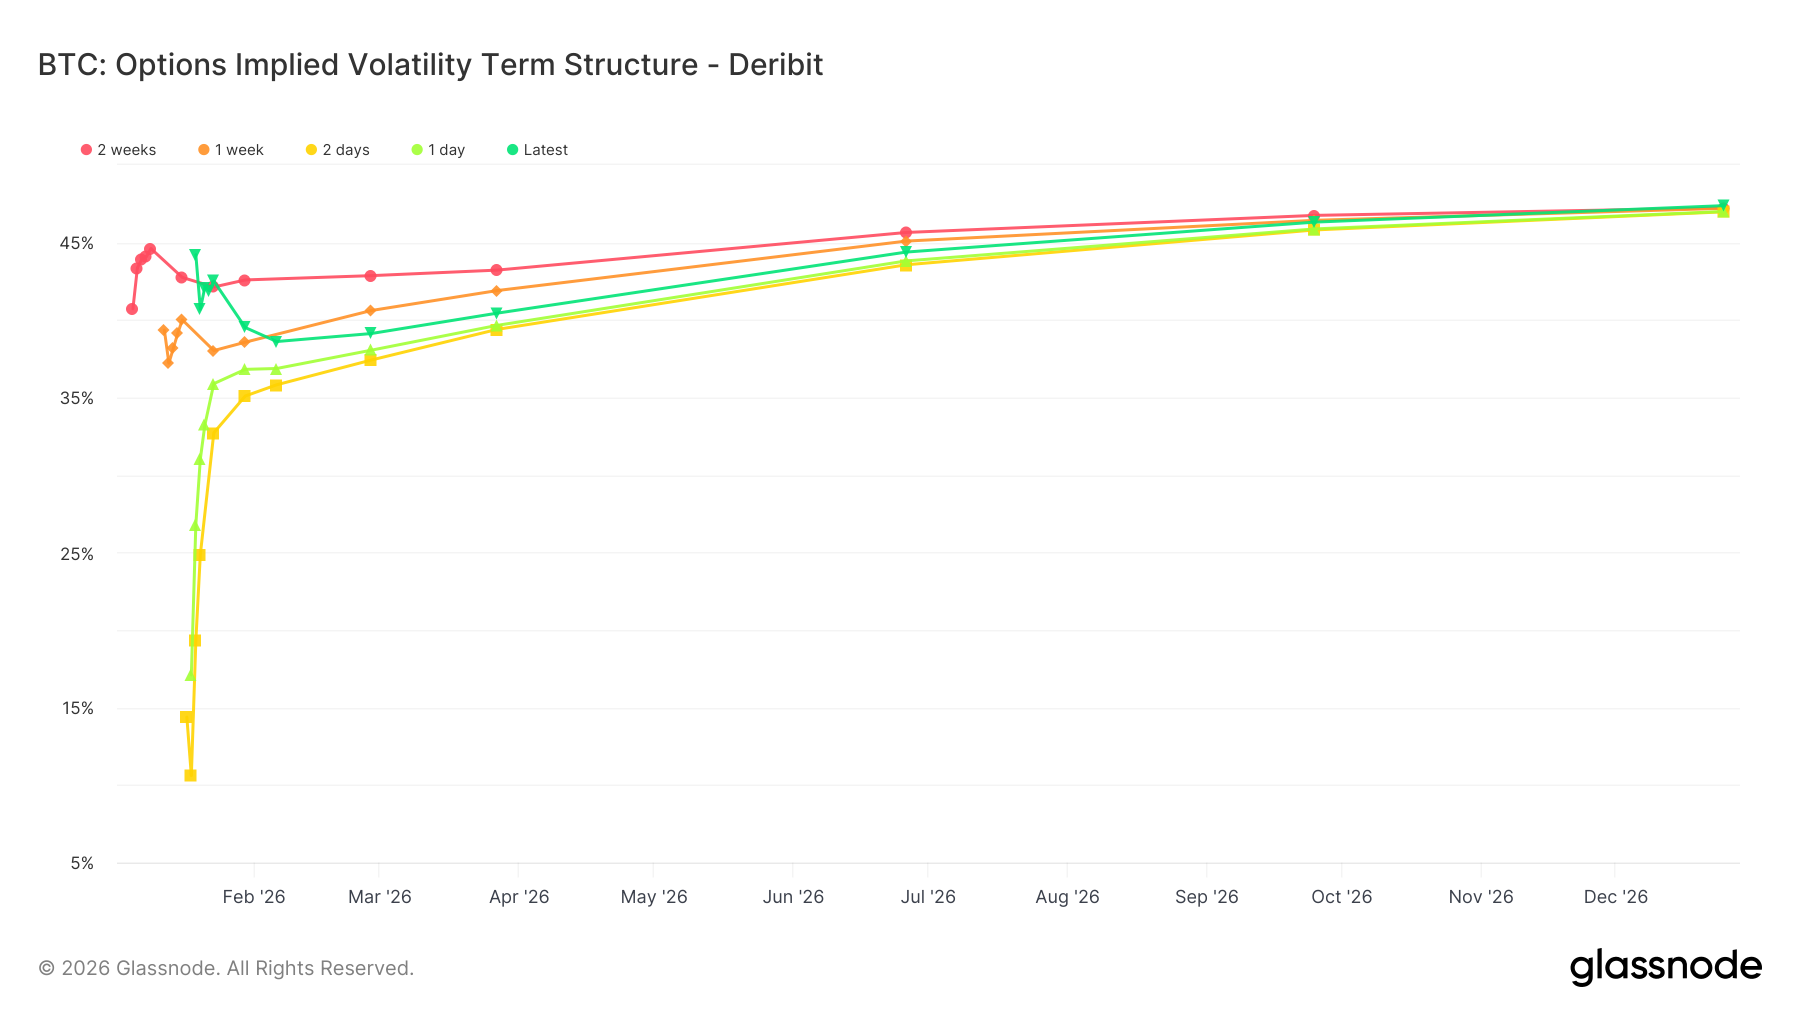
Implied volatility term structure reinforces the interpretation that recent risk pricing was reactive rather than predictive. Across maturities, the curve remains largely intact, with no meaningful inversion or acceleration that would suggest the market is pulling uncertainty forward in time. The front end of the structure shifted during the advance, but the curve failed to detach from the rest of the structure. The slope flattened modestly during the rally and then normalized quickly as price retraced, indicating that short term uncertainty was acknowledged but not escalated into a broader stress regime.
Further out, the curve remains shallow and stable. Six-month implied volatility showed little sensitivity to the price move, maintaining a narrow range despite visible changes in spot behavior. The absence of upward pressure on longer maturities suggests that the market did not reinterpret the rally as the start of a new volatility regime. Risk was not pushed forward, nor was duration meaningfully repriced. This stability across the curve indicates that participants adjusted exposure to near term variability without committing to a structural shift in expectations. The options market responded to movement, but it did not reprice the path ahead.
Mapping Skewed Vulnerability
The implied volatility smile for the February expiry offers a focused view of how uncertainty is distributed when time is allowed to matter. Unlike very short-dated options, this maturity filters out transient gamma demand and reveals where participants are structurally willing to pay for convexity. The smile remains anchored by a pronounced downside skew, where implied volatility rises materially as strikes move below spot. This reflects persistent demand for downside protection even as overall volatility compresses, suggesting that protection is being maintained as a baseline condition rather than added with urgency.
On the upside, implied volatility increases more gradually. While out-of-the-money calls reprice higher as strikes extend, the slope of the right wing remains controlled, showing no evidence of convexity being chased aggressively or upside tails being repriced as imminent. Upside participation appears conditional, expressed through limited convex exposure rather than a broad distributional shift.
Importantly, the smile remains well anchored around the at-the-money region without a parallel lift across strikes or a migration of the minimum. This indicates that uncertainty has not been redistributed across outcomes, but instead managed through selective tail pricing. Taken together, the smile reinforces a message of skewed vulnerability. The market is mapping where stability holds and where it breaks, revealing an imbalance where the path of least resistance is defined by the thinness of conviction beyond the current spot.
Conclusion
Across premium, implied volatility level, and the shape of the curve, the options market treated the move as an episode rather than a transition. The retracement failed to generate a volatility echo, and longer-dated pricing remained anchored, suggesting that participants adjusted for near term variability without reviving the broader distribution of outcomes.
The most important signal is not that volatility is low, but that it is being kept local. The market continues to insure downside as a baseline condition while reserving upside convexity for selective strikes and limited horizons. In that structure, the path of least resistance is not defined by a directional forecast, but by the thinness of conviction beyond the current spot regime.
This indicates that the broader participant base is effectively sidelined and mispositioned for runaway upside. Consequently, a sustained move higher would likely force these sidelined players to chase the market, turning the current lack of conviction into a primary catalyst for aggressive repricing.
I found that edition of BI not particular helpful nor did I understand it.
Can't you include a market outlook such as 4weeks: bearish, 2month: neutral