
Bitcoin's Seasonal Pattern
What does October usually do?

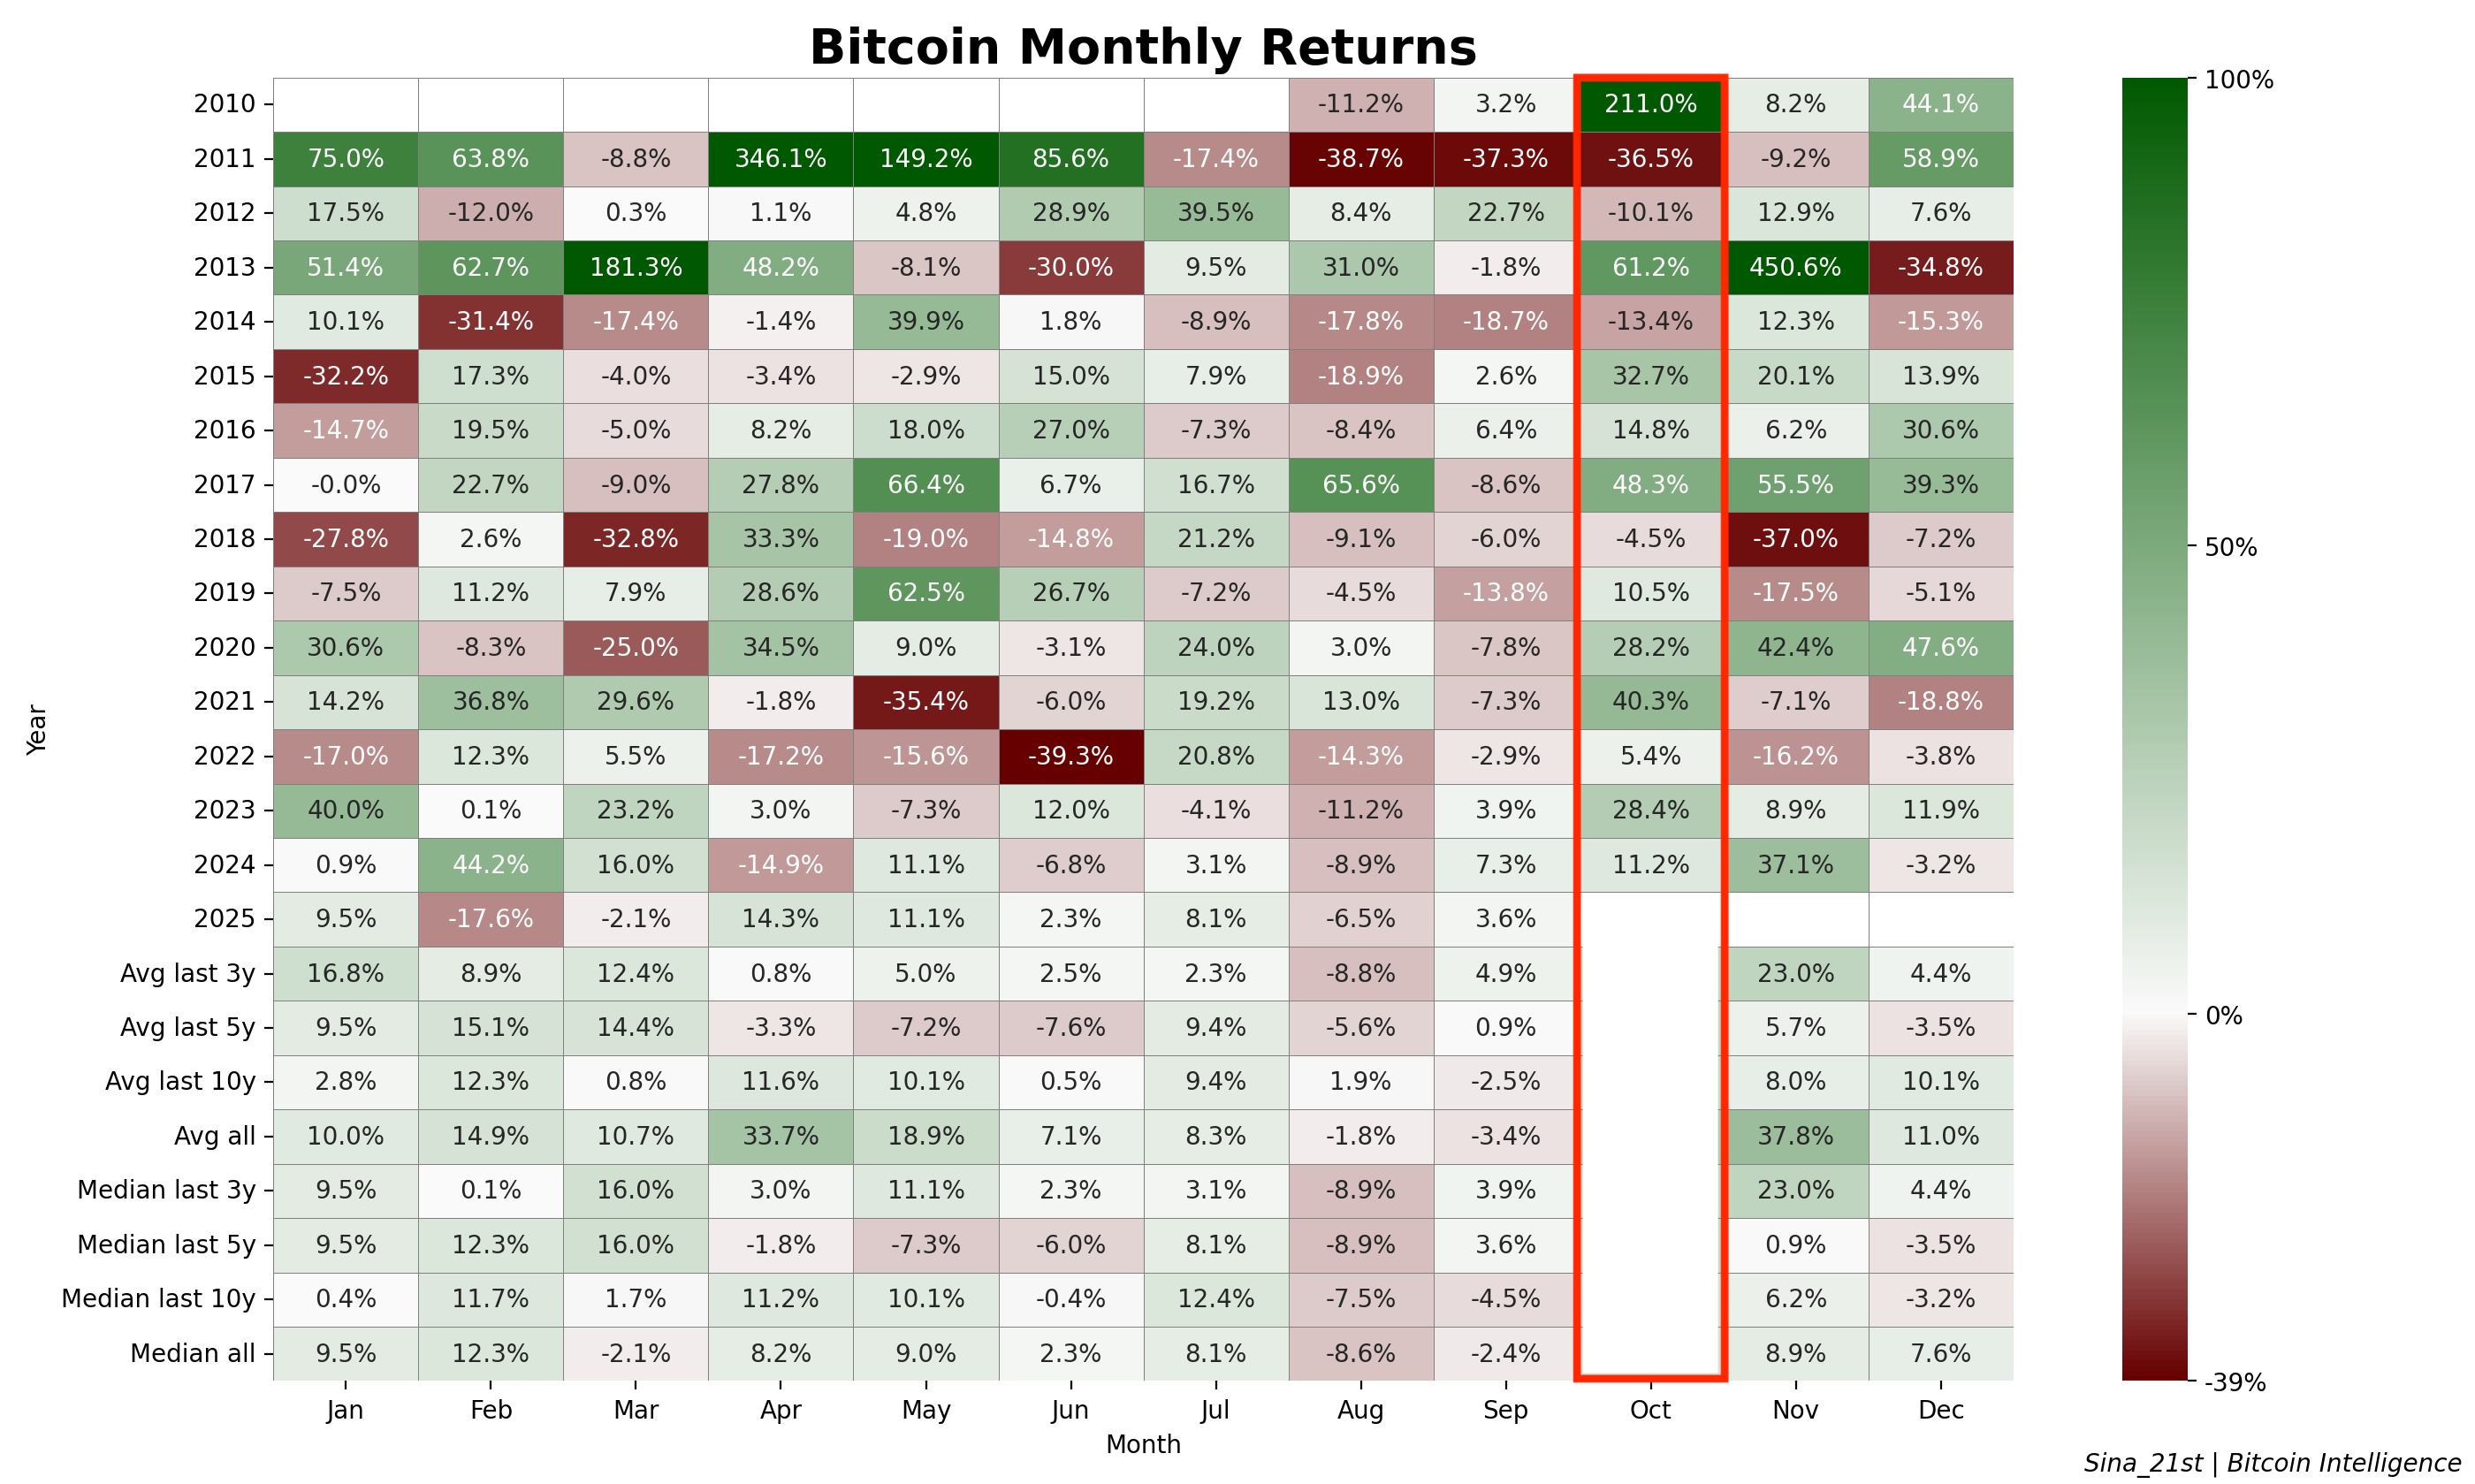
Last month, in the BI report, we analyzed Bitcoin seasonality and wrote this about September.
“September has historically ranked as the second-worst month, with a median decline of –2.9%. However, the past five years show a modest positive median return of +0.5%. More importantly, in the last three years, September has delivered a solid rebound after August’s selloffs, with a median gain of +5.6%.”
Seasonal patterns in stock returns refer to recurring calendar-based trends that investors have observed over time, such as the January effect where small-cap stocks often rally after year-end tax-loss selling, the “Sell in May and go away” pattern where returns from November to April tend to outperform those from May to October, the turn-of-the-month effect when stocks rise around month-end, and the day-of-the-week effect where Mondays are weaker while Fridays are stronger. Markets also show a holiday effect, with optimism pushing prices higher before holidays, and heightened volatility during earnings seasons.
September indeed marked an end to “Aughost’s” blues and returned a solid +3.6%.
What does the analysis say about October?
Keep reading with a 7-day free trial
Subscribe to Bitcoin Intelligence to keep reading this post and get 7 days of free access to the full post archives.